Data Visualization
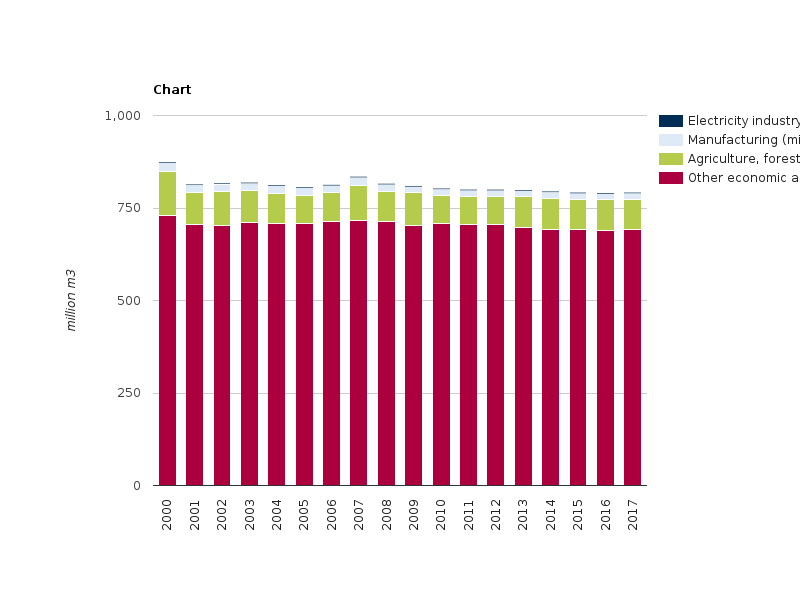
Figure 2 - Development of total freshwater use in the Republic of Moldova (2000-2017)
RichTextValue object. (Did you mean .raw or .output?)
This project is funded by the European Union