C3 – Total water use in the Republic of Moldova
Is water use decreasing in the Republic of Moldova?
Figure 1 - Development of total freshwater use in the Republic of Moldova (2000-2017)
Data sources:
Water use (without repeated and circulating water), in territorial aspect provided by Statistical Databank of the National Bureau of Statistics of the Republic of Moldova
Water use provided by the Agency Apele Moldovei
Note: Data in excel table was provided by the Agency Apele Moldovei to the European Environment Agency under the ENI SEIS II East Project.
Figure 2 - Development of total freshwater use in the Republic of Moldova (2000-2017)
Data sources:
Water use (without repeated and circulating water), in territorial aspect provided by Statistical Databank of the National Bureau of Statistics of the Republic of Moldova
Water use provided by the Agency Apele Moldovei
Note: Data in excel table was provided by the Agency Apele Moldovei to the European Environment Agency under the ENI SEIS II East Project.
Figure 3 - Water use by economic activity in the Republic of Moldova (2017)
Data sources:
Water use (without repeated and circulating water), in territorial aspect provided by Statistical Databank of the National Bureau of Statistics of the Republic of Moldova
Water use provided by the Agency Apele Moldovei
Note: Data in excel table was provided by the Agency Apele Moldovei to the European Environment Agency under the ENI SEIS II East Project.
Moldova (including the territory on the left bank of the Nistru river) is experiencing relatively higher water stress conditions, with an annual water exploitation index of 13 %. Moldova is highly dependent on surface water, particularly on water abstracted from the Dniester river. This makes Moldova highly dependent on the external inflow in its water balance. Annually, Moldova uses around 800 million m3 of water, of which 85 % is met from surface water resources. There are two main sources for water use: the Dniester river, which provides almost 90 % of the water use from surface waters, and the Prut river.
There has been a decreasing trend in water use over time. Annual freshwater use had decreased by about 9 % in 2017 compared with 2000. Various reasons underlie this decrease. One of the main reasons is that there is around 3 % less water available from renewable water resources between 2000 and 2017.
Around 7-8 % of total water abstraction is lost in the transport system because of leakages, water loss from open channels and ageing of the infrastructure. This amounts to between 55 and 77 million m3 of water. Since 2000, no progress in improving the water transport system has been observed, which would result in less water lost from it.
The sector using the largest amount of water in Moldova (including the territory on the left bank of the Nistru river) is the heating and hot water supply sector. In 2017, water use by this sector amounted to 556 hm3 of water, which corresponds to 72 % of the total water use in the country. The sectors that are the next biggest users of water are the water supply industry (15 %) and agriculture (10 %). The remaining water is used by the construction and service sectors.
Is water efficiently used by economic activities?
Figure 4 - Development of total freshwater use per unit of gross domestic product at purchasing power parity in the Republic of Moldova (2000-2017)
Data sources:
Water use (without repeated and circulating water), in territorial aspect provided by Statistical Databank of the National Bureau of Statistics of the Republic of Moldova
Water use provided by the Agency Apele Moldovei
Note: Data in excel table was provided by the Agency Apele Moldovei to the European Environment Agency under the ENI SEIS II East Project.
Gross Domestic Products provided by World Bank
In the country, GDP more than doubled between 2000 and 2017 (from 8.4 billion international dollars in 2000 up to 18.4 billion international dollars in 2017; World Bank, 2018), while total freshwater use per unit of GDP has decreased by about 60 % (not including information on the left bank of the Nistru river). This has been achieved by decreasing water use while still maintaining the upward trend in GDP, which represents a substantial increase in the efficiency of total water use per unit of GDP. In 2000, around 104 m3 of water was used in producing 1 000 international dollars by the economy, which decreased to 43 m3 of water used in 2017 to produce the same unit of GDP. However, it should be noted that 43 m3 of water per GDP unit still is very high and further improvements need to be made in the years to come.
Indicator specification
Indicator definition
The indicator specifies the availability of freshwater from natural sources and its use to meet the needs of households, agriculture, industry and other economic activities. The water use is provided as a total for the whole country and broken down by economic activity according to the International Standard Industrial Classification of All Economic Activities (ISIC). Moreover, the indicator shows total water use per unit of GDP.
Units
The total volume of freshwater use and the volume by economic activity are measured in million cubic metres (hm3) per year; the GDP at purchasing power parity (PPP) at constant prices (2011) was taken from the World Bank.
Rationale
Justification for indicator selection
The indicator provides a measure of freshwater use, as well as the pressure on the environment in terms of consumption of freshwater resources. The indicator is also important for defining the level of development of water economy services and the degree of water accessibility to cover the needs of the population and society.
Scientific references
-
Nadejda, C., 2018. Water Law No.272, 23 December 2011, new changes and complements. Powerpoint presentation, the 4th meeting of the national policy dialogue coordination committee on integrated water resources management in the Republic of Moldova.
-
UNECE, 2014. Republic of Moldova –Environmental Performance Reviews – third review, United Nations Economic Commission for Europe, Environmental Performance Reviews Series No. 39, e-ISBN 978-92-1-056518, New York and Geneva.
-
UNECE, 2018. Guidelines for the Application of Environmental Indicators, Description of C3: Total water use.
-
UNECE, 2018. Guidelines for the Application of Environmental Indicators, Glossary of terms – C3: Total water use.
Policy context and targets
Context description
National policy context
Government Decision No 932 of the Republic of Moldova requires systematic monitoring and recording of the status of surface waters and groundwater.
The Water Law No.272 endorsed by the Government of the Republic of Moldova aims to establishwater use rights and promoting investment in water as well as ensure a sufficient supply of surface water and good groundwater, which is necessary for a sustainable, balanced and equitable use of water.
International policy context
Sustainable Development Goal (SDG) 6 of the UN Sustainable Development Agenda for the period up to 2030 is to ‘ensure access to water and sanitation for all’. One of indicators of SDG 6, indicator 6.4.2, is the ‘level of water stress: freshwater withdrawal as a proportion of available freshwater resources’, which shows the importance of a sustainable water policy.
Targets
National targets
No national target has been specified.
International targets
UN SDG 6, target 6.4: by 2030, substantially increase water use efficiency across all sectors and ensure sustainable withdrawals and supply of freshwater to address water scarcity and substantially reduce the number of people suffering from water scarcity.
Related policy documents
-
Government Decision No 932 of 20 November 2013 on the approval of the regulation on the systematic monitoring and recording of the status of surface water and groundwater. (no link has been provided)
-
Sustainable Development Goals. UN (2016). Sustainable development goals, the sustainable development agenda.
-
Water Law No.272, 2011. Ministry of Agriculture, regional Development and the Environment of the Republic of Moldova.
Methodology
Methodology for indicator calculation
Units and equations
|
ID |
Component |
Units |
Equation |
|
C2.3 |
Freshwater abstracted |
million m3/year |
= C 2.3 (see indicator C2) |
|
C3.1 |
Desalinated water |
million m3/year |
|
|
C3.2 |
Reused water |
million m3/year |
|
|
C3.3 |
Imports of water |
million m3/year |
|
|
C3.4 |
Exports of water |
million m3/year |
|
|
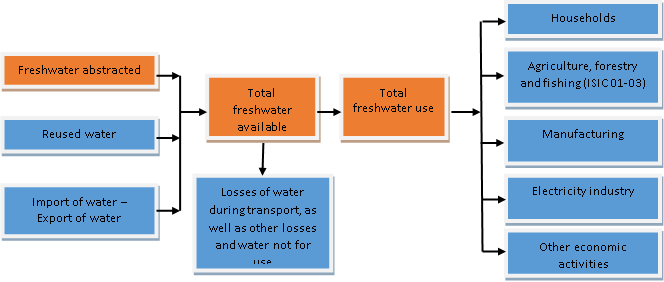
C3.5 |
Total freshwater available |
millionm3/year |
= C 2.3 + C 3.1 + C 3.2 + C 3.3 + C 3.4 |
|
C3.6 |
Losses of water during transport |
million m3/year |
|
|
C3.6a |
Other losses and water not for use |
million m3/year |
|
|
C3.7 |
Total freshwater use |
million m3/year |
= C 3.5 - C 3.6 - C 3.6a; = C3.8 + C3.9 + C3.11 + C3.12 + C3.13 |
|
C3.8 |
Households |
million m3/year |
|
|
C3.9 |
Agriculture, forestry and fishing (ISIC 01-03) |
million m3/year |
|
|
C3.10 |
of which used for irrigation in agriculture |
million m3/year |
|
|
C3.11 |
Manufacturing (ISIC 10-33) |
million m3/year |
|
|
C3.12 |
Electricity industry (ISIC 351) |
million m3/year |
|
|
C3.13 |
Other economic activities |
million m3/year |
|
|
C3.14 |
GDP at PPP at constant prices (2011) |
Billion international dollars/year |
|
|
C3.15 |
Total freshwater use per unit of GDP |
m3/1 000 international dollars |
= C3.7/C3.14 |
Methodology for gap filling
No gap filling has been performed.
Methodology references
-
EEA, 2005. EEA core set of indicators guide. EEA Technical report No 1/2005, ISBN 92-9167-757-4, Luxembourg.
-
UNECE, 2018. Guidelines for the Application of Environmental Indicators, Data template – C3: Total water use.
-
UNECE, 2018. Guidelines for the Application of Environmental Indicators, Description of C3: Total water use.
-
UNECE, 2018. Guidelines for the Application of Environmental Indicators, Glossary of terms – C3: Total water use.
-
UNSD and UNEP, 2013. Questionnaire 2013 on Environment Statistics. United Nations Statistics Division and United Nations Environment Programme, Questionnaire 2013 on Environment Statistics, Section Water.
Uncertainties
Methodology uncertainty
No uncertainty has been specified.
Data sets uncertainty
The data on the GDP at PPP does not cover the territory on left bank of the Nistru river.
Because of incomplete data, the renewable water resources have not been properly estimated.
Rationale uncertainty
No uncertainty has been specified.
Data sources
Water use (without repeated and circulating water), in territorial aspect provided by Statistical Databank of the National Bureau of Statistics of the Republic of Moldova
Water use provided by the Agency Apele Moldovei
Note: Data in excel table was provided by the Agency Apele Moldovei to the European Environment Agency under the ENI SEIS II East Project.
Gross Domestic Products provided by World Bank