Data Visualization
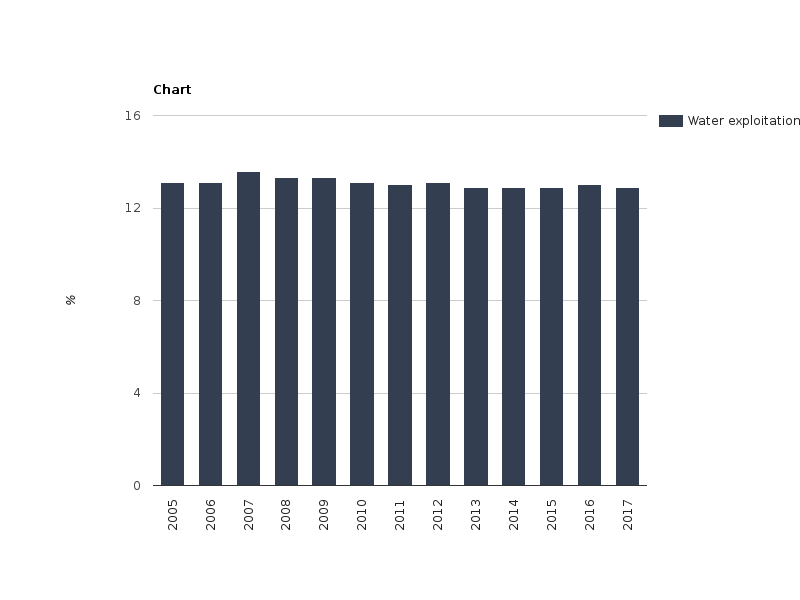
Figure 1- Development of annual water exploitation index in the Republic of Moldova (2005-2017)
RichTextValue object. (Did you mean .raw or .output?)