C2 – Freshwater abstraction in the Republic of Moldova
Is freshwater abstraction sustainable in the Republic of Moldova?
Water exploitation index (WEI) in the Republic of Moldova
Figure 1- Development of annual water exploitation index in the Republic of Moldova (2005-2017)
Note: Estimated renewable water resources exposes high uncertainty due to missing data on actual evapotranspiration
Data sources:
Water abstraction, in territorial aspect provided by Statistical Databank of the National Bureau of Statistics of the Republic of Moldova
Water abstraction provided by the Agency Apele Moldovei
Note: Data in excel table was provided by the Agency Apele Moldovei to the European Environment Agency under the ENI SEIS II East Project.
The Republic of Moldova is experiencing relatively higher water stress conditions compared with its neighbouring countries and has an annual WEI of around 13 %. On the other hand, the country is still quite far from being under severe water stress conditions. The WEI illustrates the level of pressure of water abstraction on renewable water resources. Renewable water resources, overall, are under the control of climate conditions. In particular, they are affected by precipitation and actual evapotranspiration. During wet years (high precipitation and low actual evapotranspiration), the WEI would be relatively lower, while in dry years, even though water abstraction remains at the same level, the WEI would be higher. Although national data are not available, external inflow of water is part of the country’s renewable water resources. In this context, dependency on the inflow of water in the Dniester river is crucial.
Is water abstraction decreasing?
Figure 2 - Development of water abstraction by source in the Republic of Moldova (1990-2017)
Data sources:
Water abstraction, in territorial aspect provided by Statistical Databank of the National Bureau of Statistics of the Republic of Moldova
Water abstraction provided by the Agency Apele Moldovei
Note: Data in excel table was provided by the Agency Apele Moldovei to the European Environment Agency under the ENI SEIS II East Project.
Despite high uncertainties around the estimate of renewable water resources in Moldova, the rough estimate of the annual renewable freshwater resources is around 6 500 million m3, of which 725 million m3 of water is abstracted annually to meet the water demand of economic sectors. Total freshwater abstraction in 2017 (713 million m3) was slightly below the annual average.
The country abstracts 85 % of its annual water needs from surface waters, especially from the Dniester river. The Dniester basin is also a very important source of groundwater abstraction. Around 84 % of total water abstraction from groundwater occurs from that basin. However, it should be noted that, because an adequate monitoring programme is not in place, particularly for self-abstraction, this figure has high uncertainty. It is expected that the annual total water abstraction, particularly from groundwater resources, would be much higher.
There is a high variation in the level of water abstraction between 1990 and 2000. This may be explained by the impact of the transition period during which the country changed its land management and tenure system. Between 1990 and 2000, there was a decrease of almost 75 % in annual water abstraction. However, there are a number of projects running that are investing in improving the water transport system in the country, which should contribute to this substantial decrease in water abstraction over time. Nevertheless, since 2000, annual water abstraction has been showing quite a steady trend.
What are the pressures of economic activities on freshwater resources?
Figure 3- Development of water abstraction by economic activities in the Republic of Moldova (2000-2017)
Data sources:
Water abstraction, in territorial aspect provided by Statistical Databank of the National Bureau of Statistics of the Republic of Moldova
Water abstraction provided by the Agency Apele Moldovei
Note: Data in excel table was provided by the Agency Apele Moldovei to the European Environment Agency under the ENI SEIS II East Project.
Figure 4 - Water abstraction by economic activities in the Republic of Moldova (2017)
Data sources:
Water abstraction, in territorial aspect provided by Statistical Databank of the National Bureau of Statistics of the Republic of Moldova
Water abstraction provided by the Agency Apele Moldovei
Note: Data in excel table was provided by the Agency Apele Moldovei to the European Environment Agency under the ENI SEIS II East Project.
As there are insufficient data available, it is hard to assess the actual level of pressure from individual economic sectors. In 2017 the heating and hot water supply sector was the biggest sector that abstracts water (66 %), followed by the water supply industry (20 %) and agriculture (11 %). These shares have been more or less steady since 2000. In the coming years, it is expected that water abstraction for agriculture will increase because of policy reforms in the agriculture sector, which is the main income generator in the country’s economy (UNECE, 2014).
Indicator specification
Indicator definition
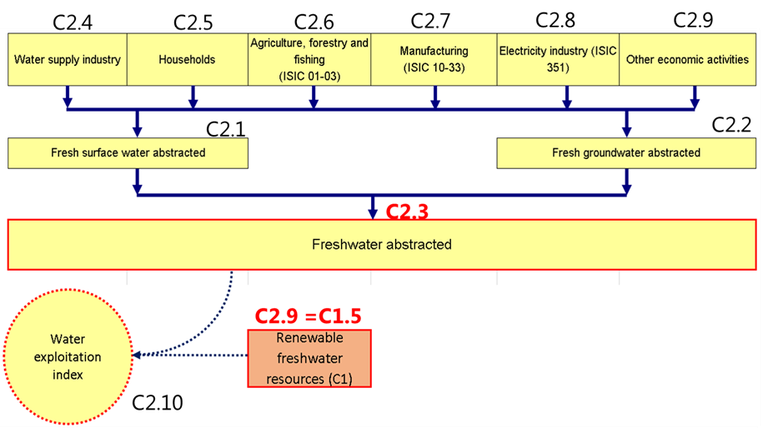
The total volume of freshwater abstracted annually (surface and groundwater) – provided in total, by economic activity in accordance with the International Standard Industrial Classification of All Economic Activities (ISIC) and as a percentage of renewable freshwater resources – i.e. as the country’s water exploitation index (WEI).
Units
The total volume of freshwater abstraction and the volume by economic activity are measured in million cubic metres (million m3) per year; the WEI is expressed as a percentage.
Rationale
Justification for indicator selection
Monitoring of freshwater abstraction and use is important for the protection of water resources and their conservation for the future taking into account the development of economic activities, as well as possible climate change impacts.
The WEI is a water scarcity indicator that provides information on the level of pressure that human activity exerts on the natural water resources of a territory.
Scientific references
-
UNECE, 2014. Republic of Moldova –Environmental Performance Reviews – third review, United Nations Economic Commission for Europe, Environmental Performance Reviews Series No. 39, e-ISBN 978-92-1-056518, New York and Geneva.
-
UNECE, 2018. Guidelines for the Application of Environmental Indicators, Description of C4: Household water use per capita.
-
UNECE, 2018. Guidelines for the Application of Environmental Indicators, Glossary of terms – C4: Household water use per capita.
Policy context and targets
Context description
National policy context
Government Decision No 932 of the Republic of Moldova requires systematic monitoring and recording of the status of surface waters and groundwater.
International policy context
Sustainable Development Goal (SDG) 6 of the UN Sustainable Development Agenda for the period up to 2030 is to ‘ensure access to water and sanitation for all’. One of indicators of SDG 6, indicator 6.4.2, is the ‘level of water stress: freshwater withdrawal as a proportion of available freshwater resources’, which shows the importance of a sustainable water policy.
Targets
National targets
No national target has been specified.
International targets
UN SDG 6, target 6.4: by 2030, substantially increase water use efficiency across all sectors and ensure sustainable withdrawals and supply of freshwater to address water scarcity and substantially reduce the number of people suffering from water scarcity.
Related policy documents
-
Government Decision No 932 of 20 November 2013 on the approval of the regulation on the systematic monitoring and recording of the status of surface water and groundwater. (no link has been provided)
-
Sustainable Development Goals. UN (2016). Sustainable development goals, the sustainable development agenda.
Methodology
Methodology for indicator calculation
Units and equations
|
ID |
Component |
Units |
Equation |
|
C2.1 |
Fresh surface water abstracted |
million m3/year |
|
|
C2.2 |
Fresh groundwater abstracted |
million m3/year |
|
|
C2.3 |
Freshwater abstracted |
million m3/year |
= C 2.1 + C 2.2; = C 2.4 + C 2.6 + C 2.7 + C 2.8 + C 2.9 |
|
C2.4 |
Water supply industry (ISIC 36) |
million m3/year |
|
|
C2.6 |
Agriculture, forestry and fishing (ISIC 01-03) |
million m3/year |
|
|
C2.7 |
Manufacturing (ISIC 10-33) |
million m3/year |
|
|
C2.8 |
Electricity industry (ISIC 351) |
million m3/year |
|
|
C2.9 |
Other economic activities |
million m3/year |
|
|
C2.10 |
Renewable freshwater resources (surface) |
million m3/year |
|
|
C2.11 |
Water exploitation index for surface water |
percentage % |
= C 2.1/C 2.10 |
Methodology for gap filling
No gap filling has been performed.
Methodology references
-
EEA, 2005. EEA core set of indicators guide. EEA Technical report No 1/2005, ISBN 92-9167-757-4, Luxembourg.
-
UNECE, 2018. Guidelines for the Application of Environmental Indicators, Data template – C2: Freshwater abstraction.
-
UNECE, 2018. Guidelines for the Application of Environmental Indicators, Description of C2: Freshwater abstraction.
-
UNECE, 2018. Guidelines for the Application of Environmental Indicators, Glossary of terms – C2: Freshwater abstraction.
-
UNSD and UNEP, 2013. Questionnaire 2013 on Environment Statistics. United Nations Statistics Division and United Nations Environment Programme, Questionnaire 2013 on Environment Statistics, Section Water.
Uncertainties
Methodology uncertainty
No methodological uncertainty has been specified.
Data sets uncertainty
Reported data on water abstraction and water use do not have sufficient spatial and temporal coverage. In addition, data on water abstraction for households is not available, therefore, households are not included in the calculation.
Renewable water resources expose high uncertainty due to missing data on actual evapotranspiration.
Rationale uncertainty
No uncertainty has been specified.
Data sources
Water abstraction, in territorial aspect provided by Statistical Databank of the National Bureau of Statistics of the Republic of Moldova
Water abstraction provided by the Agency Apele Moldovei
Note: Data in excel table was provided by the Agency Apele Moldovei to the European Environment Agency under the ENI SEIS II East Project.
Territorial Statistics provided by Statistical Databank of the National Bureau of Statistics of the Republic of Moldova
Systematic monitoring and recording of the state of surface waters, groundwater and protected areas are carried out by the central body of the Ministry of Agriculture, Regional Development and Environment through the subordinated institutions in the manner established by a regulation approved by the government. Drinking water, irrigation water and bathing water are monitored by the Ministry of Health, Labour and Social Protection.