D1 - Nationally designated protected areas of Georgia
What progress has been made with regard to the national designation of protected areas as a tool for biodiversity conservation?
Figure 1 - Change in the number and size of nationally designated protected areas in Georgia (2011-2019)
Data sources:
Protected areas database provided by Agency of Protected Areas of Georgia, under the ENI SEIS II East project activities
Figure 2 - Share of protected areas of the territory of Georgia (2019)
Data sources:
Protected areas database provided by Agency of Protected Areas of Georgia, under the ENI SEIS II East project activities
The total area of nationally designated protected areas in Georgia was 697 250 ha in 2019, corresponding to 9.9 % of the country’s territory. Georgia adopted its national biodiversity strategy and action plan 2014-2020. It sets a national target (target c.4-i3) of having, by 2020, at least 12 % of the country’s terrestrial and inland water areas and 2.5 % of marine areas covered by protected areas. Georgia is quite close to reaching the national target. As a State Party to the Convention on Biological Diversity (CBD), Georgia made substantial progress between 2007 and 2019 by expanding the protected areas network from 7.1 % of the territory in 2007 to 9.9 % in 2019. However, the Aichi biodiversity target aims to have, by 2020, at least 17 % of terrestrial and inland water areas and 10 % of coastal and marine areas, especially areas of particular importance for biodiversity and ecosystem services, conserved through effectively and equitably managed, ecologically representative and well-connected systems of protected areas and other effective area-based conservation measures and integrated into the wider landscape and seascape (see Aichi biodiversity target 11: https://www.cbd.int/sp/targets/rationale/target-11/). With a coverage of 9.5 % of its territory, Georgia is still far from reaching that target.
As shown in Figure 1, there has been growth in number and area of nationally designated areas in Georgia, although it has been levelling off in recent years. The expansion of protected areas and their role in protecting biodiversity have to be considered and assessed within the wider environment and in a climate change perspective. Despite all efforts, the designation of protected areas is not a guarantee of protecting biodiversity. Therefore, beyond this quantitative analysis, specific information on site management and quality would help to complete the assessment of progress towards Aichi biodiversity target 11.
Figure 3 - Progress in protected areas by nationally designated types in Georgia (2007-2019)
Data sources:
Protected areas database provided by Agency of Protected Areas of Georgia, under the ENI SEIS II East project activities
Figure 4 - Nationally designated protected areas by International Union for Conservation of Nature (IUCN) management categories (2007-2019)
Data sources:
Protected areas database provided by Agency of Protected Areas of Georgia, under the ENI SEIS II East project activities
Georgia has a high diversity of protected areas, which vary in size, aim and management approach. Analysis shows that between 2007 and 2019 the most common International Union for the Conservation of Nature and Natural Resources (IUCN) category of terrestrial protected areas in Georgia was national parks (designated as category II), which have increased by 40 % since 2007. At first the main focus was given to the desgination of national parks and natural monuments , with natural monument and habitat/species management areas being established later. Since 2011-2012, the total area of natural monuments (IUCN category III) has increased almost eight times from 314.5 ha to 2749 ha. Habitat/species management areas (IUCN category IV) and protected landscapes (IUCN category V) showed a comparatively slow pace of growth for the same period. However, category IV protected areas have been planned and will be adopted in 2019, which will contribute to the exsiting values and benefits of protected areas. Georgia has been introducing the category of Protected area with sustainable use of natural resources (Cat.VI) into its national protected area system since 2011. In 2019, around 4.5 % of total area of nationally designated protected areas is covered by the category of the Protected area with sustainable use of natural resources. Moreover, expansion of the nationally desginated protected areas in the country has been defined as one of the priority areas of work between 2014 and 2020 (MENRP, 2014).
Figure 5 - The spatial complementarity between European designation (Emerald Network) and national designations by share of terrestrial area (2018)
Data sources:
- Protected areas database provided by Agency of Protected Areas of Georgia, under the ENI SEIS II East project activities
- Roekaerts, M. and Opermanis, O., 2018. Status of the Emerald Network of Areas of Special Conservation Interest in 2018, Group of Experts on Protected Areas and Ecological Networks 9th Meeting, T-PVS/PA (2018) 11, Council of Europe, Strasbourg. (accessed 15 March 2019)
The nationally protected area system and the Emerald Network under the Bern Convention are the two most important coordinated European networks of protected areas. The degree of overlap between nationally protected areas and Emerald sites illustrates the extent to which a country has made use of nationally designated areas to underpin its Emerald designation and to what extent Emerald sites extend beyond national systems.
The total area of the Emerald Network in Georgia is 851 604.3 ha (39 sites) in 2019, which covers 12.22 % of the country’s territory, and the area coincides with 40.7 % of nationally protected areas. In addition, Georgia has 7 candidate sites and 12 proposed sites with the total area of 188 587.4 ha to be included into the Emerald network in 2019.
Nationally desginated areas outside of the Emerald Network account for 412 636 ha. The Emerald Network covers a wider area compared with the national desgination types. Almost 95 % of all nationally desginated protected areas are located within the Emerald Network.
As for the management objectives, in most cases Emerald sites overlap with nationally designated sites under IUCN categories I (nine sites) and II (eight sites), which aim primarily to protect ecological processes and biodiversity and have adopted management plans.
However, many Emerald sites also overlap with IUCN categories III, IV and V, particularly in mountainous regions, which supports the idea that the Emerald Network is not restricted to nature reserves but also serves the broader principle of conservation and sustainable land use.
Regarding the ownership of the land tenure in protected areas, 63 % of the area of nationally designated areas, corresponding to 39 sites, is under the management of the Agency of Protected Areas.
Map 1 – Nationally designated protected areas of Georgia, 2018

Data sources:
Provided by the Agency of Protected Areas of Georgia, 2019 under the ENI SEIS II East project activities
Map 2 – Designation status of Emerald Network sites in Georgia, 2019
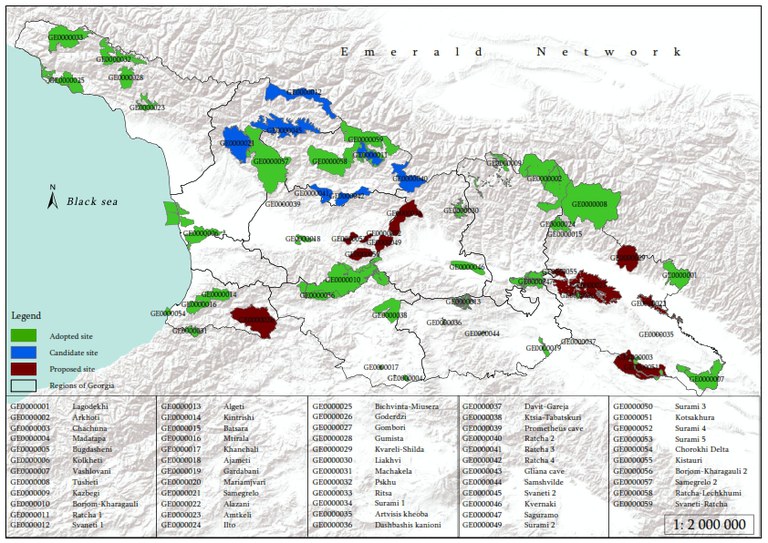
Data sources:
Provided by the Agency of Protected Areas of Georgia, 2019 under the ENI SEIS II East project activities
Indicator specification
Indicator definition
The proposed definition is a combination of the D1 UNECE Environmental Indicator and of the Streamlined European Biodiversity Indicators (SEBI) 007 indicator.
The indicator shows the terrestrial area protected in compliance with the national legislation and its development over time. It reflects both the extent of protected areas and their share in the total area of the country.
The indicator can be further broken down by IUCN management categories and by category of national designation (national park, strict nature reserve, protected landscape etc.). In addition, a sub-indicator showing the relation between nationally designated areas at national level and areas designated as Emerald sites can be developed.
Units
Area (ha) of nationally protected areas as a percentage of the country territory.
Rationale
Justification for indicator selection
Establishment of protected areas is a direct response to concerns over biodiversity loss, so an indicator of protected area coverage is a valuable indication of commitment to conserving biodiversity and reducing loss at a range of levels.
The indicator demonstrates the change over time in one form of protection afforded to components of biodiversity. It provides a measure of the response to the degradation of ecosystems and the loss of biodiversity in a country. It demonstrates the extent to which areas important for conserving biodiversity, cultural heritage, scientific research (including baseline monitoring of processes in the ecosystems), recreation, natural resource maintenance and other environmental values are protected.
This indicator is also a measure of the distance to the global target, i.e. the Aichi biodiversity target and shows the national contribution to the global network of protected areas.
Scientific references
-
Dudley, N., (Editor), 2008. Guidelines for Applying Protected Area Management Categories. Gland, Switzerland: IUCN. x + 86pp. WITH Stolton, S., P. Shadie and N. Dudley (2013). IUCN WCPA Best Practice Guidance on Recognising Protected Areas and Assigning Management Categories and Governance Types, Best Practice Protected Area Guidelines Series No. 21, Gland, Switzerland: IUCN. xxpp. 978-2-8317-1636-7
-
MENRP, 2014, National Biodiversity Strategy and Action Plan of Georgia 2014-2020, Ministry of Environment and Natural Resources Protection, Tbilisi, Georgia. (accessed15 March 2019)
-
Roekaerts, M. and Opermanis, O., 2018. Status of the Emerald Network of Areas of Special Conservation Interest in 2018, Group of Experts on Protected Areas and Ecological Networks 9th Meeting, T-PVS/PA (2018) 11, Council of Europe, Strasbourg. (accessed 15 March 2019)
Policy context and targets
Context description
National policy context
This indicator measures how much Georgia is contributing to protecting special protection areas on national, regional and global scales. The indicator measures the progress in the implementation of the national biodiversity strategic action plan (NBSAP) target C.4-i3 and in national reports to the CBD and the Bern Convention.
International policy context
The United Nations Convention on Biological Diversity aimed at the establishment and maintenance of comprehensive, effectively managed and ecologically representative national and regional systems of protected areas.
Targets
National targets
The national biodiversity strategic action plan sets a target (target C.4-i3) of, by 2020, at least 12 % of the country’s terrestrial and inland water areas and 2.5 % of marine areas being covered by protected areas.
International targets
Under the CBD, the strategic plan for biodiversity 2011-2020 was adopted, which requires that, by 2020, at least 17 % of terrestrial and inland water areas, and 10 % of coastal and marine areas, especially areas of particular importance for biodiversity and ecosystem services, are conserved through effectively and equitably managed, ecologically representative and well-connected systems of protected areas and other effective area-based conservation measures, and integrated into the wider landscapes and seascapes (Aichi biodiversity target 11).
Related policy documents
-
MENRP, 2014, National Biodiversity Strategy and Action Plan of Georgia 2014-2020, Ministry of Environment and Natural Resources Protection, Tbilisi, Georgia. (accessed15 March 2019)
-
Convention on the Conservation of European Wildlife and Natural Habitats – Bern Convention - 1979
Methodology
Methodology for indicator calculation
It is necessary for this indicator to have a database of all nationally protected areas in the country, including name of the protected area, date of establishment, protection regime in accordance with national legislation (and relevant international requirements), size and digital boundaries.
To break down results by IUCN management category, it is necessary for each protected area to be characterised according to the type of management applied, following the IUCN guidelines.
To assess the (spatial) complementarity between Emerald site designation and nationally protected areas, two datasets are necessary (to be overlaid): (1) spatial delineation of nationally protected areas; and (2) spatial delineation of Emerald sites (only candidate and officially designated Emerald sites to be considered).
The percentage of protected areas can be calculated by the formula:
Share of protected areas (%) = (total area of protected areas in hectares or km2/total area of the country in hectares or km2) × 100.
Protected area coverage can be calculated nationally and by sub-national administrative unit of terrestrial and/or marine area.
Methodology for gap filling
No methodology for gap filling has been specified.
Methodology references
Georgia has been implementing a national protected areas system close to the definition of the IUCN management categories.
-
Dudley, N. (Editor),2008. Guidelines for Applying Protected Area Management Categories. Gland, Switzerland: IUCN. x + 86pp. WITH Stolton, S., P. Shadie and N. Dudley (2013). IUCN WCPA Best Practice Guidance on Recognising Protected Areas and Assigning Management Categories and Governance Types, Best Practice Protected Area Guidelines Series No. 21, Gland, Switzerland: IUCN. xxpp. 978-2-8317-1636-7
-
EEA, 2005. EEA core set of indicators guide. EEA Technical report No 1/2005, ISBN 92-9167-757-4, Luxembourg.
-
EEA, 2018. Nationally designated protected areas. CSI 008, SEBI 007.
-
UNECE, 2018. Guidelines for the Application of Environmental Indicators, Data template – D1. Protected areas.
-
UNECE, 2018. Guidelines for the Application of Environmental Indicators, Description of D1. Protected areas.
-
UNECE, 2018. Guidelines for the Application of Environmental Indicators, Glossary of terms – D1. Protected areas.
Uncertainties
Methodology uncertainty
The indicator ‘Progress in the designation of protected areas by IUCN category over time’ could not be clearly defined, as many nationally protected areas may include a territory with several IUCN categories. The specific definition of the IUCN category is possible by a separate expert assessment.
Data sets uncertainty
No data set uncertainty has been specified.
Rationale uncertainty
The indicator does not describe the quality of management or whether or not the areas are protected from incompatible uses. The indicator needs to be complemented by information on management effectiveness or funding or by other elements that would indicate the potential of the designated area to protect biodiversity.
Data sources
-
Protected areas database provided by Agency of Protected Areas of Georgia, under the ENI SEIS II East project activities
-
Roekaerts, M. and Opermanis, O., 2018. Status of the Emerald Network of Areas of Special Conservation Interest in 2018, Group of Experts on Protected Areas and Ecological Networks 9th Meeting, T-PVS/PA (2018) 11, Council of Europe, Strasbourg. (accessed 15 March 2019)