Data Visualization
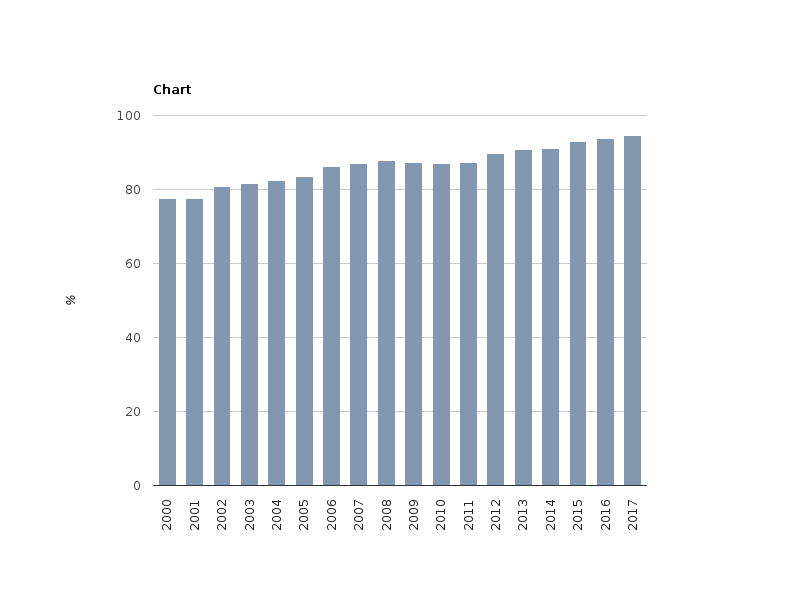
Figure 1- Population connected to water supply industry in Belarus (2000-2017)
RichTextValue object. (Did you mean .raw or .output?)
This project is funded by the European Union