C5 – Water supply industry and the population connected to the water supply industry in the Republic of Belarus
Is the percentage of Belarusian citizens with access to improved water supply services increasing?
Figure 1- Population connected to water supply industry in Belarus (2000-2017)
С. 5. Water supply industry and population connected to water supply industry provided by Belstat (National Statistical Committee of the Republic of Belarus)
Figure 2 - Development of net volume of water supplied by water supply industry and water losses during transport in the Republic of Belarus (2001-2017)
С. 5. Water supply industry and population connected to water supply industry provided by Belstat (National Statistical Committee of the Republic of Belarus)
The water supply industry provides water to the public for various purposes such as domestic use and drinking, agriculture, industry and many other sectors.
Belarus has been investing in renewing and expanding the water supply network in recent years. The total length of the public water supply network increased from 31 156 km in 2010 up to 38 204 km in 2017. During the same time period, the total length of network renewed was about 1 295 km, corresponding to 3.4 % of the existing supply network. As a result of these investments, water losses in the water supply system have decreased.
In 2017, the water supply industry supplied 553 million m3 of water, which corresponds to 40 % of the total annual water abstraction in the country.
It was estimated that in 2017, about 95 % of Belarusian citizens were connected to the water supply system, which corresponds to a 17 % increase compared with 2000. Sub-programme 5, ‘pure water’ of the state programme ‘Comfort accommodations and an enabling environment for 2016-2020’ aims to supply of drinking water to all public consumers by the end of 2020. Belarus is very close to achieving this target, and the trend in the improvement of the water supply system is encouraging.
In addition, there is also declining trend in water losses during transport. Although in 2001, around 125 million m3 was lost in the water supply network, this volume decreased to 99 million m3 in 2017.
Indicator specification
Indicator definition
This indicator presents the volume of water supplied to the users by the water supply industry, taking into account water losses during transport and the population connected to the water supply industry, as a total and as a share in the total population.
Units
The total volume of water supplied by the water supply industry is measured in million cubic metres (million m3) per year; the share of the total population connected to the water supply industry is provided as a percentage.
Rationale
Justification for indicator selection
The indicator is important for defining the level of development of the water economy services and the degree of water accessibility to cover the needs of the population. The indicator also helps to identify trends in water supply in the country.
Scientific references
-
Council of Ministers of the Republic of Belarus, 2016. State programme “Comfort accommodations and an enabling environment for 2016-2020”, Decree No. 326, 21 April 2016, Minsk.
-
UNECE, 2016. Belarus –Environmental Performance Reviews – third review, United Nations Economic Commission for Europe, Environmental Performance Reviews Series No. 44, e-ISBN 978-92-1-057737-3, New York and Geneva.
-
UNECE, 2018. Guidelines for the Application of Environmental Indicators, Description of C4: Household water use per capita.
-
UNECE, 2018. Guidelines for the Application of Environmental Indicators, Glossary of terms – C4: Household water use per capita.
Policy context and targets
Context description
National policy context
Improving the quality of drinking water supply is a priority task of sub-programme 5 ‘pure water’ of the state programme ‘Comfort accommodations and an enabling environment for 2016-2020’.
International policy context
SDG 6 of the Sustainable Development Agenda for the period up to 2030 aims ‘to ensure access to water and sanitation for all’. Target 6.1 of SDG 6 is also aiming, ‘by 2030, to achieve universal and equitable access to safe and affordable drinking water for all’. Similarly, Target 6.2 states the aim of ‘by 2030, achieving access to adequate and equitable sanitation and hygiene for all and end open defecation, paying special attention to the needs of women and girls and those in vulnerable situations’.
Targets
National targets
As a result of the implementation of sub-programme 5 (pure water) of the state programme ‘Comfort accommodations and an enabling environment for 2016-2020’, the supply of drinking water to consumers should be 100 % by the end of 2020.
International targets
UN SDG 6, target 6.4: by 2030, substantially increase water use efficiency across all sectors and ensure sustainable withdrawals and supply of freshwater to address water scarcity and substantially reduce the number of people suffering from water scarcity.
Related policy documents
-
Council of Ministers of the Republic of Belarus, 2016. State programme “Comfort accommodations and an enabling environment for 2016-2020”, Decree No. 326, 21 April 2016, Minsk.
-
National Strategy for Sustainable Social and Economic Development of the Republic of Belarus up to 2030. Presidium of the Council of Ministers of the Republic of Belarus, 2017. Protocol No. 10, 2 May 2017, Minsk.
-
Law of the Republic of Belarus on drinking water supply, 1999. Law No. 271-3, Official Gazette of the Republic of Belarus, National Gazette No.165-166, 31 August 1999, Minsk.
-
Sustainable Development Goals. UN (2016). Sustainable development goals, the sustainable development agenda.
-
The concept of national security of the Republic of Belarus (2010). Online portal of national legal instruments of the Republic of Belarus.
-
The Road Map of the National Statistical Committee of the Republic of Belarus on developing statistics on the Sustainable Development Goals (2011). National Statistical Committee of the Republic of Belarus, Minsk.
-
Water Strategy of the Republic of Belarus up to 2030 in the context of climate change. Ministry of Natural Resources and Environmental Protection of the Republic of Belarus, Board Decision No. 72-P, 08 November 2011.
Methodology
Methodology for indicator calculation
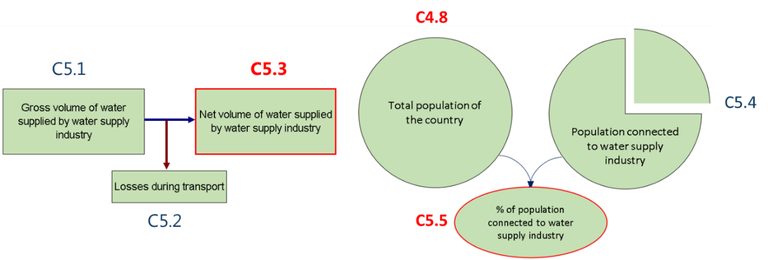
Units and equations
|
ID |
Component |
Units |
Equation |
|
C5.1 |
Gross volume of water supplied by water supply industry (ISIC 36) |
million m3/year |
|
|
C5.2 |
Losses during transport (ISIC 36) |
million m3/year |
|
|
C5.3 |
Net volume of water supplied by water supply industry (ISIC 36) |
million m3/year |
= C 5.1 - C 5.2 |
|
C4.8 |
Total population of the country |
million persons |
|
|
C5.4 |
Population connected to water supply industry (estimation) |
million persons |
|
|
C5.5 |
Population connected to water supply industry |
percentage (%) |
Methodology for gap filling
The estimation of the population connected to the water supply industry is calculated by multiplying the share of households living in apartments/houses equipped with piped water (urban and rural) by the number of households (urban and rural), and by the average size of household (urban and rural).
Methodology references
-
Belstat, 2019. The system of classifications used in state statistics.
-
EEA, 2005. EEA core set of indicators guide. EEA Technical report No 1/2005, ISBN 92-9167-757-4, Luxembourg.
-
Ministry of Housing and Utilities of the Republic of Belarus, 2017. Information about the Operation of Water and Sewer Facilities, No. 97, 12 January 2017, Minsk.
-
UNECE, 2018. Guidelines for the Application of Environmental Indicators, Data template – C5: Water supply industry and population connected to water supply industry.
-
UNECE, 2018. Guidelines for the Application of Environmental Indicators, Description of C5: Water supply industry and population connected to water supply industry
-
UNECE, 2018. Guidelines for the Application of Environmental Indicators, Glossary of terms – C5: Water supply industry and population connected to water supply industry.
-
UNSD and UNEP, 2013. Questionnaire 2013 on Environment Statistics. United Nations Statistics Division and United Nations Environment Programme, Questionnaire 2013 on Environment Statistics, Section Water.
Uncertainties
Methodology uncertainty
No uncertainty has been specified.
Data sets uncertainty
No uncertainty has been specified.
Rationale uncertainty
No uncertainty has been specified.
Data sources
-
С. 5. Water supply industry and population connected to water supply industry provided by Belstat (National Statistical Committee of the Republic of Belarus)