Data Visualization
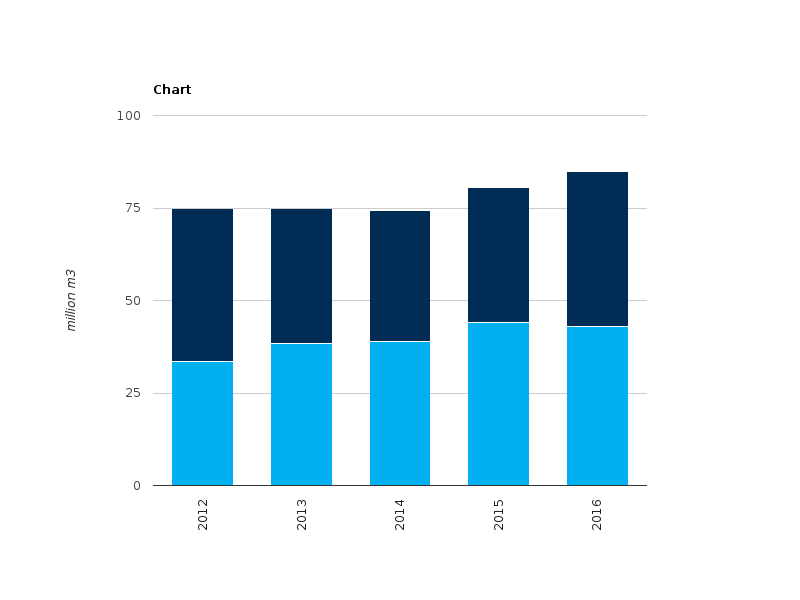
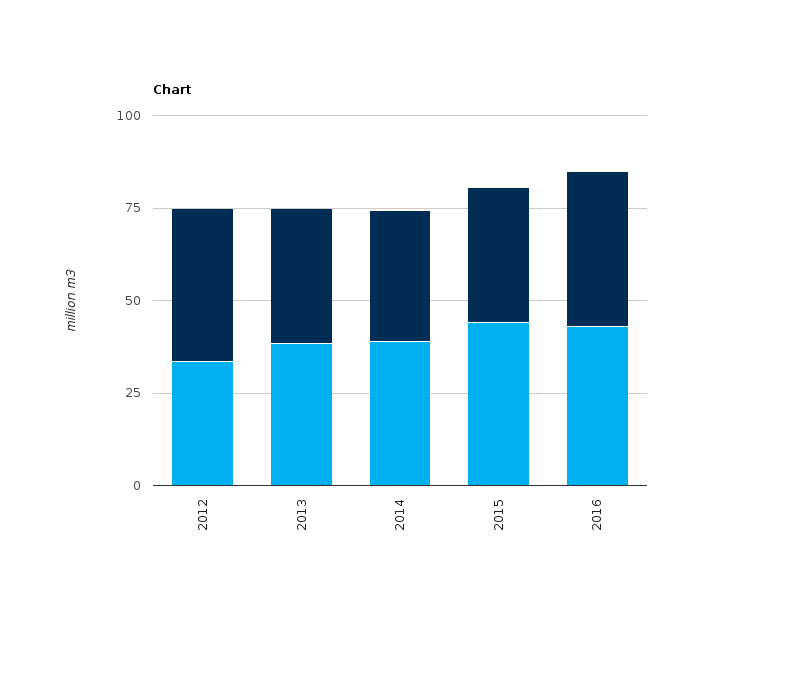
Figure 2- Development of net volume of water supplied by water supply industry and water losses during transport in the Republic of Moldova (2012-2016)
RichTextValue object. (Did you mean .raw or .output?)