C5 – Water supply industry and population connected to water supply industry in the Republic of Armenia
Is the percentage of Armenian citizens with access to improved water supply services increasing?
Figure 1- Population connected to water supply industry in the Republic of Armenia (2000-2017)
Data sources:
(C6) Population connected to public water supply by indicators and years provided by ArmStatBank
Figure 2 - Development of net volume of water supplied by water supply industry and water losses during transport in the Republic of Armenia (2000-2017)
Data sources:
(C5) Public water supply by purpose and years provided by ArmStatBank
(C7) Water losses by NACE and years provided by ArmStatBank
The water supply industry provides water to the public for various purposes, such as for domestic use and drinking, and to agriculture, industry and many other sectors.
In 2017, around 572 million m3 of water was supplied by the water supply system in Armenia, out of which 451 million m3 was lost in the water supply network, which corresponds to 78.8 % of the total water supplied.
According to the UNECE environmental performance assessment, during the 2000s, around 80 % of the pipes were more than 10 years old and 55 % were more than 20 years old.
Their maintenance had been neglected. The number of interruptions in supply was increasing regularly (UNECE, 2000).
During recent years, Armenia has been investing in improving the public water supply network, particularly to rural areas (Water Committee Report, 2019). By means of these investments, 97.3 % of the population is now connected to the water supply system. However, the water losses in the network are still incredibly high and putting pressure on renewable water resources. In parallel to a slight decrease in the total population, the total water supplied by the water supply industry also decreased by 5.1 % between 2000 and 2017. Despite that, due to the ageing of the current network, water losses have been steadily and proportionally increasing. For instance, around 66 % of the total water supply was lost in 2000, but losses increased to 78.8 % in 2017.
The high rate of water losses in the transport system and the increasing trend does not look sustainable in the long term in Armenia.
Indicator specification
Indicator definition
This indicator presents the volume of water supplied to the users by the water supply industry, taking into account water losses during transport and the population connected to the water supply industry, as a total and as a share of the total population.
Units
The total volume of water supplied by the water supply industry is measured in million cubic metres per year; the share of the total population connected to the water supply industry is provided as a percentage.
Rationale
Justification for indicator selection
The indicator is important for defining the level of development of the water economy services and the degree of water accessibility to cover the needs of the population. The indicator also helps to identify trends in the water supply.
Scientific references
-
ArmStatBank, 2018. Environmental economic accounts, Water accounts, Physical water use and supply tables by years, indicators and NACE categories and types.
-
UNECE, 2000. Environmental Performance Review- Armenia. United Nations Economic Commission for Europe, Committee on Environmental Policy, Environmental Performance Reviews Series No. 10, ISBN 92-1-116775-2, New York.
-
UNECE, 2018. Guidelines for the Application of Environmental Indicators, Description of C5: Water supply industry and population connected to water supply industry.
-
UNECE, 2018. Guidelines for the Application of Environmental Indicators, Glossary of terms – C5: Water supply industry and population connected to water supply industry.
Policy context and targets
Context description
National policy context
The Law of the Republic of Armenia on the fundamentals of the national water policy is aimed at meeting the basic needs of the population and ensuring the maintenance and utilisation of renewable water resources and the quantity needed to reduce and prevent diseases due to water shortages and to maintain aquatic ecosystems. In that context, the overall target is to satisfy the population’s everyday cultural and household water demands.
The progressive development of the strategic programme of the Republic of Armenia for 2014-2025 aims to increase the reliability and efficiency of the operation of the drinking water supply and sewage systems, reduce water losses and improve the quality of water and wastewater services.
International policy context
Sustainable Development Goal (SDG) 6 of the UN Sustainable Development Agenda for the period up to 2030 aims ‘to ensure access to water and sanitation for all’. Target 6.1 of SDG 6 is also aiming, ‘by 2030, to achieve universal and equitable access to safe and affordable drinking water for all’. Similarly, Target 6.4 states the aim to, ‘by 2030, substantially increase water use efficiency across all sectors and ensure sustainable withdrawals and supply of freshwater to address water scarcity and substantially reduce the number of people suffering from water scarcity’.
Targets
National targets
No national target has been specified.
International targets
UN SDG 6, target 6.4: by 2030, substantially increase water use efficiency across all sectors and ensure sustainable withdrawals and supply of freshwater to address water scarcity and substantially reduce the number of people suffering from water scarcity.
Related policy documents
-
Progressive Development Strategic Programme of the Republic of Armenia for 2014-2025. Government of the Republic of Armenia, 2014. Decision no. 442-N
-
Republic of the Armenia Water Code (adopted on 4 June 2002)
-
Republic of Armenia Law on the National Water Programme (adopted on 27 November 2006)
-
Republic of Armenia Law on Fundamentals of the National Water Policy (adopted on 27 May 2005)
-
Sustainable Development Goals. UN (2016). Sustainable development goals, the sustainable
development agenda.
Methodology
Methodology for indicator calculation
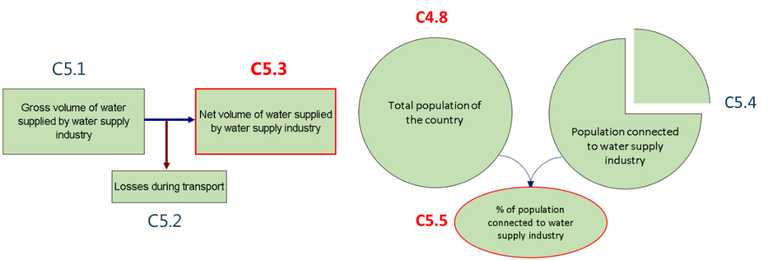
Note: Net volume of water supplied by water supply industry = gross volume of water supplied by water supply industry - losses during transport.
Units and equations
|
ID |
Component |
Units |
Equation |
|
C5.1 |
Gross volume of water supplied by water supply industry (ISIC 36) |
million m3/year |
|
|
C5.2 |
Losses during transport (ISIC 36) |
million m3/year |
|
|
C5.3 |
Net volume of water supplied by water supply industry (ISIC 36) |
million m3/year |
= C 5.1 - C 5.2 |
|
C4.8 |
Total population of the country |
million people |
|
|
C5.4 |
Population connected to water supply industry (estimation) |
million people |
|
|
C5.5 |
Population connected to water supply industry |
percentage (%) |
Methodology for gap filling
The data on population connected to the water supply industry (%) is an estimation based on the findings of the 2017 Integrated Living Conditions Survey (an annual publication), produced by the household statistics division of ArmStatBank (ArmStatBank, 2017).
Methodology references
-
ArmStatBank, 2016. Integrated Living Conditions Survey, quality declaration of households integrated living conditions survey, Yerevan.
-
EEA, 2005. EEA core set of indicators guide. EEA Technical report No 1/2005, ISBN 92-9167-757-4, Luxembourg.
-
UNECE, 2018. Guidelines for the Application of Environmental Indicators, Data template – C5: Water supply industry and population connected to water supply industry.
-
UNECE, 2018. Guidelines for the Application of Environmental Indicators, Description of C5: Water supply industry and population connected to water supply industry
-
UNECE, 2018. Guidelines for the Application of Environmental Indicators, Glossary of terms – C5: Water supply industry and population connected to water supply industry.
-
UNSD and UNEP, 2013. Questionnaire 2013 on Environment Statistics. United Nations Statistics Division and United Nations Environment Programme, Questionnaire 2013 on Environment Statistics, Section Water.
Uncertainties
Methodology uncertainty
No uncertainty has been specified.
Data sets uncertainty
No uncertainty has been specified.
Rationale uncertainty
No uncertainty has been specified.
Data sources
-
Survey on Quality Declaration of Households Integrated Living Conditions provided by ArmStatBank
-
(C5) Public water supply by purpose and years provided by ArmStatBank
-
(C6) Population connected to public water supply by indicators and years provided by ArmStatBank
-
(C7) Water losses provided by ArmStatBank