Data Visualization
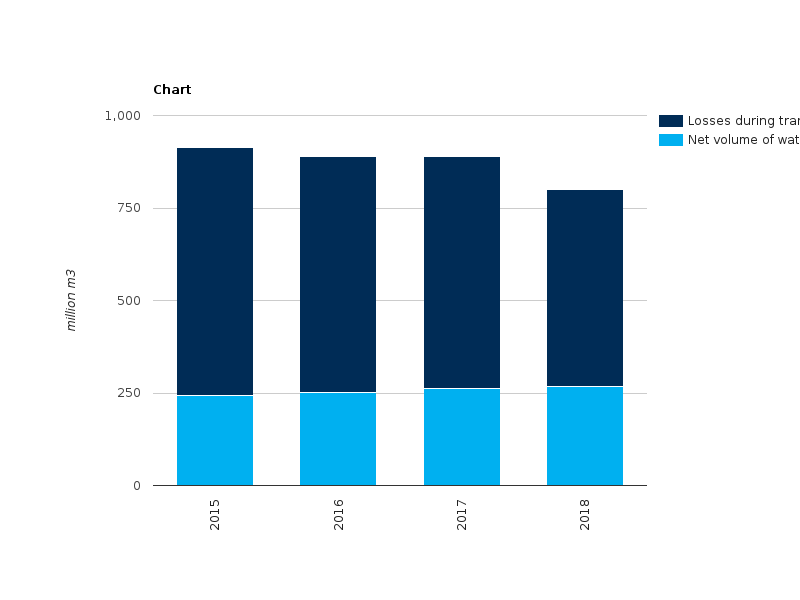
Figure 2 - Development of net volume of water suplied by water supply industry and water losses during transport (2015-2018)
RichTextValue object. (Did you mean .raw or .output?)