C5 – Water supply industry and population connected to water supply industry in Georgia
Is the percentage of Georgian citizens with access to improved water supply services increasing?
Figure 1 - Population connected to water supply industry in Georgia (2015-2018)
Data sources:
C-5. Water supply industry and population connected to water supply industry provided by National Statistics Office of Georgia
Figure 2 - Development of net volume of water suplied by water supply industry and water losses during transport (2015-2018)
Data sources:
C-5. Water supply industry and population connected to water supply industry provided by National Statistics Office of Georgia
C-7. Water losses provided by National Statistics Office of Georgia
The water supply industry provides water to the public for various purposes, such as domestic use, drinking, agriculture and industry.
800 million m3 of water was supplied by the water supply system in 2018, out of which 531 million m3 was lost in the water supply network, corresponding to 66 % of the total water supply. The water sector infrastructure has deteriorated because of a lack of adequate repair and maintenance and a shortage of funds to invest in modernising the water facilities in recent years (UNECE, 2016).
In recent years, Georgia has been improving the public water supply network. Furthermore, the total population connected to the public water supply network increased from 2.22 million to 2.45 million between 2015 and 2018, corresponding to 66 % of the total population. However, water losses in the network are still incredibly high and are putting pressure on renewable water resources.
Net volume of water supply by the water supply industry increased by 9.8 % during the period 2015-2018.
Indicator specification
Indicator definition
This indicator presents the volume of water supplied to the users by the water supply industry, taking into account water losses during transport and the population connected to the water supply industry, as a total and as a share of the total population.
Units
The total volume of water supplied by the water supply industry is measured in million cubic metres (million m3) per year; the share of the total population connected to the water supply industry is provided as a percentage.
Rationale
Justification for indicator selection
The indicator is important for defining the level of development of the water economy services and the degree of water accessibility to cover the needs of the population. The indicator also helps to identify trends in water supply.
Scientific references
UNECE, 2016. Environmental Performance Review- Georgia. United Nations Economic Commission for Europe, Committee on Environmental Policy, Environmental Performance Reviews Series No. 43, 978-92-1-057683-3, New York and Geneva.
UNECE, 2018. Guidelines for the Application of Environmental Indicators, Description of C5: Water supply industry and population connected to water supply industry.
UNECE, 2018. Guidelines for the Application of Environmental Indicators, Glossary of terms – C5: Water supply industry and population connected to water supply industry.
Policy context and targets
Context description
National policy context
The socio-economic development strategy – Georgia 2020 – set the objective of delivering high-quality drinking water to Georgian citizens in a 24-hour regime and connecting all urban areas to the water supply network
International policy context
Sustainable Development Goal (SDG) 6 of the UN Sustainable Development Agenda for the period up to 2030 aims ‘to ensure access to water and sanitation for all’. Target 6.1 of SDG 6 is also aiming, ‘by 2030, to achieve universal and equitable access to safe and affordable drinking water for all’.
Targets
National targets
Although no specific target has been identified, the aim of the Government of Georgia is to deliver a high-quality drinking water supply to the population in a 24-hour regime and to improve the water supply and sanitation system in every urban settlement and city in Georgia.
International targets
SGD 6 target 6.1 aims, ‘by 2030, to achieve universal and equitable access to safe and affordable drinking water for all’, and target 6.2 aims to, ‘by 2030, achieve access to adequate and equitable sanitation and hygiene for all and end open defecation, paying special attention to the needs of women and girls and those in vulnerable situations’.
Related policy documents
-
The socio-economic development strategy – Georgia 2020. Government of Georgia.
-
Sustainable Development Goals. UN (2016). Sustainable development goals, the sustainable
development agenda.
Methodology
Methodology for indicator calculation
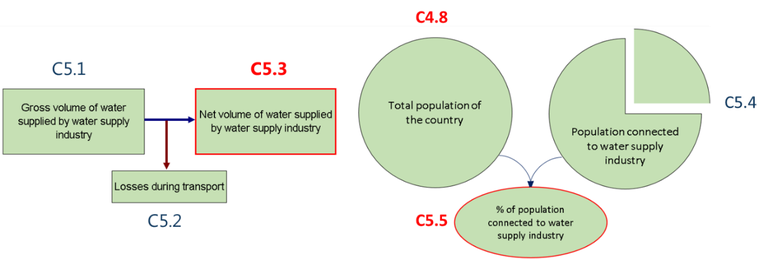
Units and equations
|
ID |
Component |
Units |
Equation |
|
C5.1 |
Gross volume of water supplied by water supply industry (ISIC 36) |
million m3/year |
|
|
C5.2 |
Losses during transport (ISIC 36) |
million m3/year |
|
|
C5.3 |
Net volume of water supplied by water supply industry (ISIC 36) |
million m3/year |
= C 5.1 - C 5.2 |
|
C4.8 |
Total population of the country |
million people |
|
|
C5.4 |
Population connected to water supply industry (estimation) |
million people |
|
|
C5.5 |
Population connected to water supply industry |
percentage (%) |
Methodology for gap filling
No gap filling has been performed.
Methodology references
-
EEA, 2005. EEA core set of indicators guide. EEA Technical report No 1/2005, ISBN 92-9167-757-4, Luxembourg.
-
UNECE, 2018. Guidelines for the Application of Environmental Indicators, Data template – C5: Water supply industry and population connected to water supply industry.
-
UNECE, 2018. Guidelines for the Application of Environmental Indicators, Description of C5: Water supply industry and population connected to water supply industry
-
UNECE, 2018. Guidelines for the Application of Environmental Indicators, Glossary of terms – C5: Water supply industry and population connected to water supply industry.
-
UNSD and UNEP, 2013. Questionnaire 2013 on Environment Statistics. United Nations Statistics Division and United Nations Environment Programme, Questionnaire 2013 on Environment Statistics, Section Water.
Uncertainties
Methodology uncertainty
No uncertainty has been specified.
Data sets uncertainty
The indicator is calculated based on the survey data from 2015 and not for the previous years. Enterprises have reliable numbers on the water supply. Since not every household has a water metering, water use is estimated based on average figures. Water losses are calculated as the difference between water supply and water use.
Rationale uncertainty
No uncertainty has been specified.
Data sources
-
C-5. Water supply industry and population connected to water supply industry provided by National Statistics Office of Georgia
-
C-7. Water losses provided by National Statistics Office of Georgia
-
Survey of Water Supply Enterprises conducted by National Statistics Office of Georgia