Data Visualization
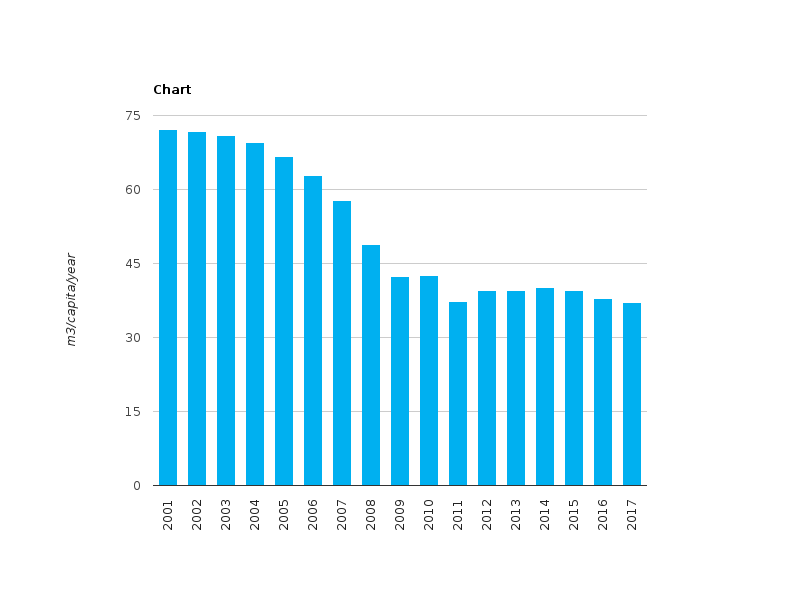
Figure 2 - Development of households water use per capita in the Republic of Belarus (2001-2017)
RichTextValue object. (Did you mean .raw or .output?)