C4 – Household water use per capita in the Republic of Belarus
Is household water use per capita decreasing in the Republic of Belarus?
Figure 1 - Development of total freshwater use by households in the Republic of Belarus (2001-2017)
Data sources:
С.4. Household water use per capita provided by Belstat (National Statistical Committee of the Republic of Belarus)
Figure 2 - Development of households water use per capita in the Republic of Belarus (2001-2017)
Data sources:
С.4. Household water use per capita provided by Belstat (National Statistical Committee of the Republic of Belarus)
Belarus is non-water-stressed country. The annual water exploitation index varies from around 2 % to around 5 %.
Water supplied to households is mainly used for drinking and cooking; hygiene, including washing for personal and domestic cleanliness; and amenity use such as car washing and lawn watering (Howard and Bartram, 2003).
In Belarus, the average annual total freshwater use is around 1 500 million m3 to meet the water demands of various sectors including households. In 2017, the total freshwater use by all sectors was around 1 264 million m3, of which 333 million m3 was water supplied by the water supply industry (27 %) to households, while around 18 million m3 (5 %) of water was self-supplied to the same sector.
According to Belstat’s estimation, annual household water use has more than halved, falling from 717 million m3 in 2001 down to 351 million m3 in 2017. Despite there being no significant change in the population of Belarus during this time period, the substantial decrease in demand for household water use can only be due to an increase in water efficiency. As stated in the UNECE third environmental performance review of Belarus in 2016, because of increased water metering, the water demand from households is expected to decline in the coming years.
In 2017, on average, a Belarusian citizen used 37 m3 of water from renewable freshwater resources. This corresponds to approximately 107 l of freshwater/capita per day.
Belarus has been investing in renewing and expanding the water supply network in recent years. The total length of public water supply network was increased from 31 156 km in 2010 up to 38 204 km in 2017. On the other hand, during the same time period, the total length of network that was renewed is about 1 295 km, which corresponds to 3.4 % of the existing supply network. By means of all these investments, water losses have decreased.
Indicator specification
Indicator definition
The quantity of water used to cover the household and related utility needs of the population through the water supply industry and self-supply.
Units
Volumes of water used by households in total are measured in million m3 and per capita in cubic metres (m3).
Rationale
Justification for indicator selection
The indicator is important for defining the level of development of the water economy services and the degree of water accessibility to cover all of the household needs of the population. The indicator also helps to identify trends in household water use in a particular country.
Scientific references
-
Council of Ministers of the Republic of Belarus, 2016. State programme “Comfort accommodations and an enabling environment for 2016-2020”, Decree No. 326, 21 April 2016, Minsk.
-
Howard, G. and Bartram, J., 2003. Domestic Water Quantity, Service Level and Health. World Health Organization, WHO/SDE/WSH/03.02, Geneva, Switzerland.
-
UNECE, 2016. Belarus –Environmental Performance Reviews – third review, United Nations Economic Commission for Europe, Environmental Performance Reviews Series No. 44, e-ISBN 978-92-1-057737-3, New York and Geneva.
-
UNECE, 2018. Guidelines for the Application of Environmental Indicators, Description of C4: Household water use per capita.
-
UNECE, 2018. Guidelines for the Application of Environmental Indicators, Glossary of terms – C4: Household water use per capita.
Policy context and targets
Context description
National policy context
Improving the quality of drinking water supply is a priority task of sub-programme 5 – pure water of the state programme “comfort accommodations and an enabling environment for 2016-2020”
International policy context
Sustainable Development Goal (SDG) 6 of the Sustainable Development Agenda for the period up to 2030 is to ‘ensure access to water and sanitation for all’. Target 6.1 of SDG 6 aims, 'by 2030, to achieve universal and equitable access to safe and affordable drinking water for all’. Similarly, Target 6.2 aims to, ‘by 2030, achieve access to adequate and equitable sanitation and hygiene for all and end open defecation, paying special attention to the needs of women and girls and those in vulnerable situations’.
Targets
No specific target has been identified.
Related policy documents
-
Council of Ministers of the Republic of Belarus, 2016. State programme “Comfort accommodations and an enabling environment for 2016-2020”, Decree No. 326, 21 April 2016, Minsk.
-
National Strategy for Sustainable Social and Economic Development of the Republic of Belarus up to 2030. Presidium of the Council of Ministers of the Republic of Belarus, 2017. Protocol No. 10, 2 May 2017, Minsk.
-
Sustainable Development Goals. UN (2016). Sustainable development goals, the sustainable development agenda.
-
The concept of national security of the Republic of Belarus (2010). Online portal of national legal instruments of the Republic of Belarus.
-
The Road Map of the National Statistical Committee of the Republic of Belarus on developing statistics on the Sustainable Development Goals (2011). National Statistical Committee of the Republic of Belarus, Minsk.
-
Water Strategy of the Republic of Belarus up to 2030 in the context of climate change. Ministry of Natural Resources and Environmental Protection of the Republic of Belarus, Board Decision No. 72-P, 08 November 2011.
Methodology
Methodology for indicator calculation
Units and equations
|
ID |
Component |
Units |
Equation |
|
C4.1 |
Water supplied to households by water supply industry |
million m3/year |
|
|
C4.2 |
Population connected to water supply industry (estimation) |
million persons |
|
|
C4.3 |
Water use per capita (water supply industry) |
m3/capita/year |
= C 4.1/C 4.2 |
|
C4.4 |
Population not connected to water supply industry (self-supply; estimation) |
million people |
= C 4.8 - C 4.2 |
|
C4.5 |
Estimated water use by households supplied by self-supply per capita |
m3/capita/year |
|
|
C4.6 |
Water use in the country (self supply) |
million m3/year |
= C 4.4 C 4.5 |
|
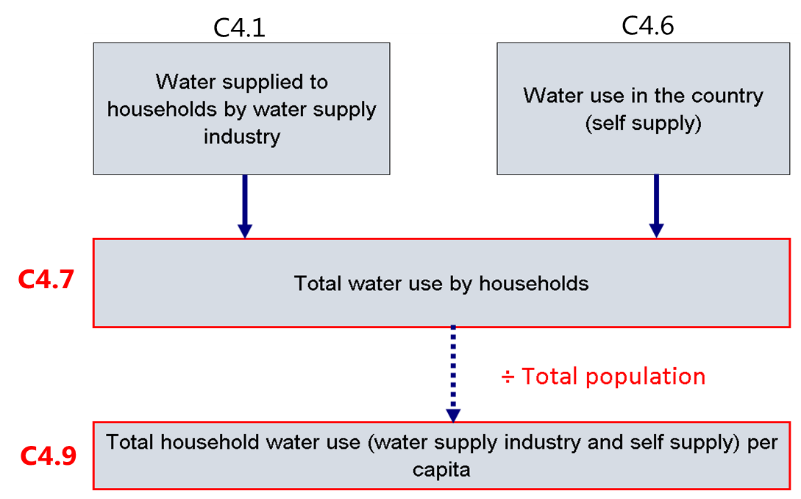
C4.7 |
Total water use by households |
million m3/year |
= C 4.1 + C 4.6 |
|
C4.8 |
Total population |
million persons |
|
|
C4.9 |
Total household water use (water supply industry and self-supply) per capita |
m3/capita/year |
= C 4.7/C 4.8 |
Methodology for gap filling
The estimation of the population connected to the water supply system is calculated by multiplying the share of households living in apartments/houses equipped with piped water (urban and rural) by the number of households (urban and rural) and by the average size of household (urban and rural).
The population not connected to the water supply system is estimated as the difference between the total population of the country and the population connected to the water supply system.
The estimation of water use by households supplied by self-supply is based on the water supplied to households by the water supply industry, as well as the population connected/not connected to the water supply system.
Components of the C4 indicator were estimated by Belstat.
Methodology references
-
Belstat, 2019. The system of classifications used in state statistics.
-
EEA, 2005. EEA core set of indicators guide. EEA Technical report No 1/2005, ISBN 92-9167-757-4, Luxembourg.
-
UNECE, 2018. Guidelines for the Application of Environmental Indicators, Data template – C4: Household water use per capita.
-
UNECE, 2018. Guidelines for the Application of Environmental Indicators, Description of C4: Household water use per capita.
-
UNECE, 2018. Guidelines for the Application of Environmental Indicators, Glossary of terms – C4: Household water use per capita.
-
UNSD and UNEP, 2013. Questionnaire 2013 on Environment Statistics. United Nations Statistics Division and United Nations Environment Programme, Questionnaire 2013 on Environment Statistics, Section Water.
Uncertainties
Methodology uncertainty
Components of the C4 indicator were estimated.
Data sets uncertainty
The population connected to the water supply system was estimated on the following data from Belstat:
-
share of households living in apartments/houses equipped with piped water (sample of household living standards);
-
number of households and average size of household (taken from the population census).
-
Estimated water use by households supplied by self-supply per capita was estimated on the following data:
-
total population total (from Belstat);
-
volume of water supplied to households by water supply industry (by the Ministry of Housing and Utilities of the Republic of Belarus).
Rationale uncertainty
No uncertainty has been specified.
Data sources
-
С.4. Household water use per capita provided by Belstat (National Statistical Committee of the Republic of Belarus)
-
Living standards provided by Belstat (National Statistical Committee of the Republic of Belarus) on the total population of Belarus, as well as the share of households living in apartments/houses equipped with piped water, number of households and average size of a household.