C3 – Total water use in the Republic of Azerbaijan
Is water use decreasing in the Republic of Azerbaijan?
Figure 1 - Development of total freshwater use in Azerbaijan (2000-2017)
Data sources:
9.1. Main indicators characterizing protection of water resources and their rational use provided by the State Statistical Committee of the Republic of Azerbaijan
Figure 2 - Development of total water use by economic activities in the Republic of Azerbaijan (2000-2017)
Data sources:
9.1. Main indicators characterizing protection of water resources and their rational use provided by the State Statistical Committee of the Republic of Azerbaijan
9.3. Main indicators characterizing water resources by types of economic activities provided by the State Statistical Committee of the Republic of Azerbaijan
Figure 3- Water use by economic activities in the Republic of Azerbaijan (2017)
Data sources:
9.1. Main indicators characterizing protection of water resources and their rational use provided by the State Statistical Committee of the Republic of Azerbaijan
9.3. Main indicators characterizing water resources by types of economic activities provided by the State Statistical Committee of the Republic of Azerbaijan
Azerbaijan faces water stress conditions, as more than 30 % of the annual freshwater resources are abstracted to meet water demands. In 2017, the estimated water exploitation index was 41.2 %. Meanwhile, the country is heavily dependent on external inflow from upstream basins where surface waters enter Azerbaijan in a heavily polluted state (UNECE, 2011). The dependency ratio for upstream is greater than 70 % of total renewable freshwater resources. Since 2000, the renewable freshwater resources have also substantially decreased by 20 %, whereas the total population of the country has increased by 22 % during the same period.
The average annual total freshwater use is around 7 678.9 million m3, and there has been a substantial increase during recent years, increasing from 7 937 hm3 in 2000 to 8 493 million m3 in 2017. More than 80 % of the annual water demand is met from surface water resources, and there has been increasing pressure on groundwater since 2000.
Agriculture is the highest water demanding sector in Azerbaijan. About 75.8 % of total freshwater use is accounted for by this sector, followed by the electricty industry (18 %) and households (3 %) in 2017. As as result of the introduction of water metering and improvements in the distribution network (UNECE, 2011), water use by households has substantially decreased (by 42 %) between 2000 and 2017, whereas the total population has increased.
Is water efficiently used by economic activities?
Figure 4 - Development of total freshwater use per unit of gross domestic product at purchasing power parity in the Republic of Azerbaijan ( 2000-2017)
Data sources:
9.1. Main indicators characterizing protection of water resources and their rational use provided by the State Statistical Committee of the Republic of Azerbaijan
9.3. Main indicators characterizing water resources by types of economic activities provided by the State Statistical Committee of the Republic of Azerbaijan
Gross Domestic Products provided by World Bank
As a result of rapid economic improvements, GDP increased by more than a factor of four (4.4) between 2000 and 2017. GDP at purchasing power parity (PPP) increased from USD 35.9 billion international dollars to USD 156.3 billion international dollars. During the same period, water use decreased from 221 m3/USD 1 000 GDP to 54.3 m3/USD 1000 GDP, indicating a relative decoupling of income generation and water use. It should be noted that the total annual freshwater use increased by 7 % over the same period. Despite the relative efficiency gained, water losses in transport and an increasing demand for water in agriculture remain countinuing major challenges in water resources management in Azerbaijan.
Indicator specification
Indicator definition
The indicator specifies the availability of freshwater from natural sources and its use to meet the needs of households, agriculture, industry and other economic activities. The water use is provided as a total for the whole country and broken down by economic activity according to the
International Standard Industrial Classification of All Economic Activities (ISIC). Moreover, the indicator shows total water use per unit of GDP.
Units
The total volume of freshwater use and the volume by economic activity are measured in million cubic metres (million m3) per year; the GDP at purchasing power parity (PPP) at constant prices (2011) was taken from the World Bank website.
Rationale
Justification for indicator selection
The indicator provides a measure of the freshwater use, as well as the pressure on the environment in terms of consumption of freshwater resources. The indicator is also important for defining the level of development of water economy services and the degree of water accessibility to cover the needs of the population and society.
Scientific references
-
UNECE, 2011. Azerbaijan –Second Environmental Performance Review, United Nations Economic Commission for Europe, Environmental Performance Reviews Series No. 31, e-ISBN 978-92-1-117035-1, New York and Geneva.
-
UNECE, 2018. Guidelines for the Application of Environmental Indicators, Description of C3: Total water use.
-
UNECE, 2018. Guidelines for the Application of Environmental Indicators, Glossary of terms – C3: Total water use.
Policy context and targets
Context description
National policy context
The water code of the Azerbaijan Republic, (1997) adopted by the Law of Azerbaijan Republic № 418-IG of December 26, 1997 - The code considers internal waters of Azerbaijan. The section of the Caspian Sea (lake) belonging to Azerbaijan is part of the national wealth of the Azerbaijani people, and it is used and protected as the basis of the life and activity of the population and to ensure the existence of flora and fauna. The code regulates the legal regulations related to the use and protection of water bodies in Azerbaijan.
International policy context
Sustainable Development Goal (SDG) 6 of the UN Sustainable Development Agenda for the period up to 2030 is to ‘ensure access to water and sanitation for all’. One of indicators of SDG 6, indicator 6.4.2, is the ‘level of water stress: freshwater withdrawal as a proportion of available freshwater resources’, which shows the importance of a sustainable water policy.
Targets
National targets
No specific national target has been identified.
International targets
UN SDG 6, target 6.4: by 2030, aim, by 2030, to substantially increase water use efficiency across all sectors and ensure sustainable withdrawals and supply of freshwater to address water scarcity and substantially reduce the number of people suffering from water scarcity.
Related policy documents
-
The water code of the Azerbaijan Republic, 1997. Adopted by the Law of Azerbaijan Republic № 418-IG of December 26, 1997.
-
Sustainable Development Goals. UN (2016). Sustainable development goals, the sustainable development agenda.
Methodology
Methodology for indicator calculation
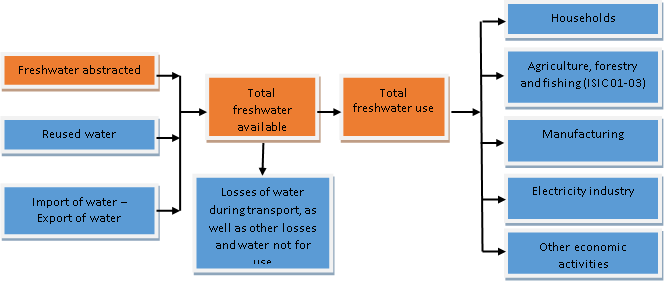
Units and equations
|
ID |
Component |
Units |
Equation |
|
C2.3 |
Freshwater abstracted |
million m3/year |
= C 2.3 (see indicator C2) |
|
C3.1 |
Desalinated water |
million m3/year |
|
|
C3.2 |
Reused water |
million m3/year |
|
|
C3.3 |
Imports of water |
million m3/year |
|
|
C3.4 |
Exports of water |
million m3/year |
|
|
C3.5 |
Total freshwater available |
millionm3/year |
= C 2.3 + C 3.1 + C 3.2 + C 3.3 + C 3.4 |
|
C3.6 |
Losses of water during transport |
million m3/year |
|
|
C3.6a |
Other losses and water not for use |
million m3/year |
|
|
C3.7 |
Total freshwater use |
million m3/year |
= C 3.5 - C 3.6 - C 3.6a; = C3.8 + C3.9 + C3.11 + C3.12 + C3.13 |
|
C3.8 |
Households |
million m3/year |
|
|
C3.9 |
Agriculture, forestry and fishing (ISIC 01-03) |
million m3/year |
|
|
C3.10 |
of which used for irrigation in agriculture |
million m3/year |
|
|
C3.11 |
Manufacturing (ISIC 10-33) |
million m3/year |
|
|
C3.12 |
Electricity industry (ISIC 351) |
million m3/year |
|
|
C3.13 |
Other economic activities |
million m3/year |
|
|
C3.14 |
GDP at PPP at constant prices (2011) |
billion international dollars/year |
|
|
C3.15 |
Total freshwater use per unit of GDP |
m3/1 000 international dollars |
= C3.7/C3.14 |
Methodology for gap filling
No methodology for gap filling has been specified.
Methodology references
-
EEA, 2005. EEA core set of indicators guide. EEA Technical report No 1/2005, ISBN 92-9167-757-4, Luxembourg.
-
UNECE, 2018. Guidelines for the Application of Environmental Indicators, Data template – C3: Total water use.
-
UNECE, 2018. Guidelines for the Application of Environmental Indicators, Description of C3: Total water use.
-
UNECE, 2018. Guidelines for the Application of Environmental Indicators, Glossary of terms – C3: Total water use.
-
UNSD and UNEP, 2013. Questionnaire 2013 on Environment Statistics. United Nations Statistics Division and United Nations Environment Programme, Questionnaire 2013 on Environment Statistics, Section Water.
Uncertainties
Methodology uncertainty
No uncertainty has been specified.
Data sets uncertainty
No uncertainty has been specified.
Rationale uncertainty
No uncertainty has been specified.
Data sources
-
Gross Domestic Products provided by World Bank
-
9.1. Main indicators characterizing protection of water resources and their rational use provided by the State Statistical Committee of the Republic of Azerbaijan
-
9.3. Main indicators characterizing water resources by types of economic activities provided by the State Statistical Committee of the Republic of Azerbaijan