C3 – Total water use in the Republic of Armenia
Is water use decreasing in the Republic of Armenia?
Figure 1 - Development of total freshwater use in the Republic of Armenia (2000-2017)
Data sources:
(C2) Freshwater abstraction (surface and groundwater) by indicators and years provided by ArmStatBank
(C3) Water use by NACE and years provided by ArmStatBank
(C7)Water losses by NACE and years provided by ArmStatBank
Figure 2 - Development of total water use by economic activities in the Republic of Armenia (2000-2017)
Data sources:
(C3) Water use by NACE and years provided by ArmStatBank
Figure 3 - Water use by economic activity in the Republic of Armenia (2017)
Data sources:
(C3) Water use by NACE and years provided by ArmStatBank
Armenia is one of the water-stressed countries facing severe water scarcity (water exploitation index was 61.4 % in 2017). Although the renewable freshwater resources do not indicate a water deficit in the overall natural water balance of the country, the high level of water abstraction and the high use of water by different sectors, particularly for agriculture, create a high pressure on the renewable freshwater resources of the country (UNECE, 2000).
The main water resources are the Arpi, Kura and Aras rivers and Lake Sevan, which meet around 65 % of the total water demand, although groundwater resources have also been increasingly used since 2000.
Around 86 % of total freshwater use is accounted for by agricultural activities in which irrigation and aquaculture share by far the largest portion (more than 70 %) of total freshwater use for this sector.
On average, 30 % of total freshwater abstraction is lost in the water transport system. During recent years, the percentage of the total freshwater abstraction that is lost during transport has slightly decreased. However, the absolute volume of water lost has increased from 758.9 million m3 in 2000 to 825.4 million m3 in 2017.
The average annual total freshwater use was around 2 550 million m3 in 2000, with a substantial decrease down to 2 040 million m3 in 2017. Considering the severe water stress conditions across the country, the current level of water abstraction and water use particularly by the agricultural sector has already exposed environmental problems. Long-term over abstraction of water from Lake Sevan has already reduced the water level in the lake by more than 16 m and has reduced the area of the surface of the lake by 140 km2 (ArmStatBank, 2016).
Is water efficiently used by economic activities?
Figure 4 - Development of total freshwater use per unit of gross domestic product at purchasing power parity in the Republic of Armenia ( 2000-2017)
Data sources:
(C3) Water use by NACE and years provided by ArmStatBank
Gross Domestic Products provided by World Bank
As the main economic sectors in Armenia depend heavily on the availability of renewable freshwater resources, water resources management plays a significant role in the country’s overall economic situation. The water input to the economy is measured by total freshwater use per unit of GDP. From 2000 to 2017, GDP in Armenia has almost tripled (USD 8.97 billion in 2000 compared with USD 25.75 billion in 2017). In parallel with that, the total water use by economic sectors has increased by 44.5 % during the same period. The relative decrease in the total freshwater use by the economy slightly improved the efficiency of water use and almost halved the total freshwater use per unit GDP.
Indicator specification
Indicator definition
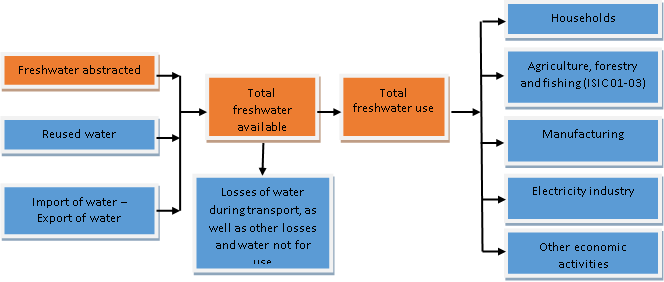
The indicator specifies the availability of freshwater from natural sources and its use to meet the needs of households, agriculture, industry and other economic activities. The water use is provided as a total for the whole country and broken down by economic activity according to the
International Standard Industrial Classification of All Economic Activities (ISIC). Moreover, the indicator shows total water use per unit of GDP.
Units
The total volume of freshwater use and the volume by economic activity are measured in million cubic metres (million m3) per year; the GDP at purchasing power parity (PPP) at constant prices (2011) was taken from the World Bank website, accessed on 12 February 2019.
Rationale
Justification for indicator selection
The indicator provides a measure of the freshwater use, as well as the pressure on the environment in terms of consumption of freshwater resources. The indicator is also important for defining the level of development of water economy services and the degree of water accessibility to cover the needs of the population and society.
Scientific references
ArmStatBank, 2016. Water use and disposal, Environment and natural resources in RA for 2016.
ArmStatBank, 2018. Environmental economic accounts, Water accounts, Physical water use and supply tables by years, indicators and NACE categories and types.
UNECE, 2000. Environmental Performance Review- Armenia. United Nations Economic Commission for Europe, Committee on Environmental Policy, Environmental Performance Reviews Series No. 10, ISBN 92-1-116775-2, New York.
UNECE, 2018. Guidelines for the Application of Environmental Indicators, Description of C3: Total water use.
UNECE, 2018. Guidelines for the Application of Environmental Indicators, Glossary of terms – C3: Total water use.
Policy context and targets
Context description
National policy context
The Republic of Armenia Water Code (2002) is the main legal document defining and regulating the concepts and relationships of the water industry. The Water Code regulates the issues relating to the protection, use and coordination of water resources and systems, as well as defining the principles and forms of private sector involvement.
The Republic of Armenia National Water Policy Act (adopted on 3 May 2005) is a conceptual framework for the strategic use and maintenance of water resources and water systems. The purpose of this law is to ensure the availability and accessibility of water resources necessary for human well-being, for the development of the country’s socio-economic system, and for the economic and ecological needs in the present and in the future.
Armenia’s national water programme (adopted on 27 November 2006) is the main document for the long-term development of water resources and water systems by which the measure to resolve the problems set forth in the Water Code are implemented. This code regulates relations related to the definition and implementation of the national water programme, involving the national water resources, strategic water resources, assessments of usable water resources, the supply and demand for water, and the main issues and prospects for water sector conservation and development.
The goal of the code is to address the needs of the population and the economy through the effective management of available water resources, to ensure the sustainability of the environment; the formation and use of strategic water resources; the protection of national water resources; and the implementation of the Water Code and the principles set out in the Law on the Principles of National Water Policy.
International policy context
Armenia presented its first voluntary national review (VNR) on the implementation of the 2030 Agenda and the Sustainable Development Goals (SDGs) at the United Nations (UN) High-level Political Forum on Sustainable Development in 2018.
The VNR presents the progress and experience gained by Armenia so far during the nationalisation and implementation process of the 2030 Agenda and the SDGs. It also aims to deliver and reflect on political, legal, practical and behavioural advantages, as well as obstacles and challenges in Armenia’s daily life regarding the implementation of the SDGs. Undoubtedly, the process confirms the cross-cutting and broad-ranging nature of the exercise that most probably will go beyond 2030 and will require concerted efforts and commitment at both national and international levels.
Targets
National targets
No specific national target has been identified.
International targets
UN SDG 6, target 6.4: by 2030, aim, by 2030, to substantially increase water use efficiency across all sectors and ensure sustainable withdrawals and supply of freshwater to address water scarcity and substantially reduce the number of people suffering from water scarcity.
Related policy documents
-
Republic of Armenia Water Code (adopted on 4 June 2002)
-
Republic of Armenia Law on the National Water Programme (adopted on 27 November 2006)
-
Republic of Armenia Law on Fundamentals of the National Water Policy (adopted on 27 May 2005)
-
SDG Implementation Voluntary National Review – Armenia. United Nations (2018). SDG Implementation Voluntary National Review – Armenia. Transformation towards sustainable and resilient societies. Report for the UN High-level Political Forum on Sustainable Development, Yerevan (accessed 12 February 2019).
-
Sustainable Development Goals. UN (2016). Sustainable development goals, the sustainable development agenda.
Methodology
Methodology for indicator calculation
Units and equations
|
ID |
Component |
Units |
Equation |
|
C2.3 |
Freshwater abstracted |
million m3/year |
= C 2.3 (see indicator C2) |
|
C3.1 |
Desalinated water |
million m3/year |
|
|
C3.2 |
Reused water |
million m3/year |
|
|
C3.3 |
Imports of water |
million m3/year |
|
|
C3.4 |
Exports of water |
million m3/year |
|
|
C3.5 |
Total freshwater available |
million m3/year |
= C 2.3 + C 3.1 + C 3.2 + C 3.3 + C 3.4 |
|
C3.6 |
Losses of water during transport |
million m3/year |
|
|
C3.6a |
Other losses and water not for use |
million m3/year |
|
|
C3.7 |
Total freshwater use |
million m3/year |
= C 3.5 - C 3.6 - C 3.6a; = C3.8 + C3.9 + C3.11 + C3.12 + C3.13 |
|
C3.8 |
Households |
million m3/year |
|
|
C3.9 |
Agriculture, forestry and fishing (ISIC 01-03) |
million m3/year |
|
|
C3.10 |
of which used for irrigation in agriculture |
million m3/year |
|
|
C3.11 |
Manufacturing (ISIC 10-33) |
million m3/year |
|
|
C3.12 |
Electricity industry (ISIC 351) |
million m3/year |
|
|
C3.13 |
Other economic activities |
million m3/year |
|
|
C3.14 |
GDP at PPP at constant prices (2011) |
billion international dollars/year |
|
|
C3.15 |
Total freshwater use per unit of GDP |
m3/1 000 international dollars |
= C3.7/C3.14 |
Methodology for gap filling
Interpolation was mainly used for filling the gaps in the parameters required for the calculation of this indicator. Irrigated area and mean factor of water abstraction for irrigation is widely used in calculating freshwater use for irrigation.
Methodology references
-
EEA, 2005. EEA core set of indicators guide. EEA Technical report No 1/2005, ISBN 92-9167-757-4, Luxembourg.
-
UNECE, 2018. Guidelines for the Application of Environmental Indicators, Data template – C3: Total water use.
-
UNECE, 2018. Guidelines for the Application of Environmental Indicators, Description of C3: Total water use.
-
UNECE, 2018. Guidelines for the Application of Environmental Indicators, Glossary of terms – C3: Total water use.
-
UNSD and UNEP, 2013. Questionnaire 2013 on Environment Statistics. United Nations Statistics Division and United Nations Environment Programme, Questionnaire 2013 on Environment Statistics, Section Water.
Uncertainties
Methodology uncertainty
No methodology uncertainty has been specified.
Data sets uncertainty
The time series of the underlying data between 1990 and 2011 has been compiled based on the definition of parameters introduced in the underlying data and has been applied in accordance with the United Nations Statistics Division (UNSD) questionnaire on environmental statistics, whereas the data covering 2011 onwards has been collected according to the parameters’ definition of the UNECE environmental indicators. This creates a large break in time series, particularly for the water supply industry and agriculture.
Rationale uncertainty
No uncertainty has been specified.
Data sources
-
Environmental statistics provided by ArmStatBank
-
Gross Domestic Products provided by World Bank
-
Water accounts provided by ArmStatBank