Data Visualization
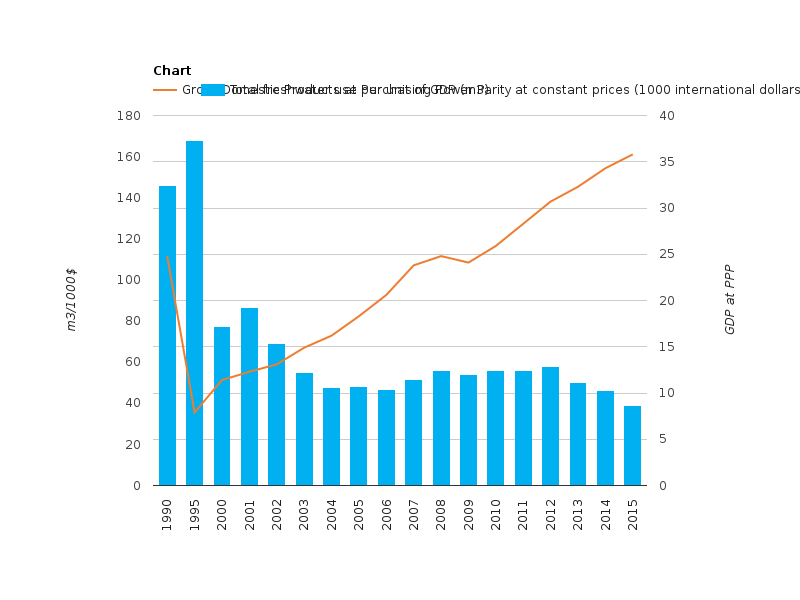
Figure 4 - Development of total freshwater use per unit of gross domestic product at purchasing power parity (1990-2015)
RichTextValue object. (Did you mean .raw or .output?)