C3 – Total water use in Georgia
Is water use decreasing in Georgia?
Figure 1 - Development of total freshwater use in Georgia (1990-2016)
Data sources:
Water use data provided by Water Division of the Department of Environment and Climate Change and the Integrated Management Division of the Department of Environmental Assessment, Ministry of Environmental Protection and Agriculture
Figure 2 - Development of total water use by economic activities in Georgia (1990-2016)
Data sources:
Water use data provided by Water Division of the Department of Environment and Climate Change and the Integrated Management Division of the Department of Environmental Assessment, Ministry of Environmental Protection and Agriculture
Figure 3 - Water use by economic activity in Georgia (2016)
Data sources:
Water use data provided by Water Division of the Department of Environment and Climate Change and the Integrated Management Division of the Department of Environmental Assessment, Ministry of Environmental Protection and Agriculture
Georgia is non-water-stressed country. The annual water exploitation index varies from around 2 % to around 5 % . Annual total freshwater use is around 1 400 million m3. Georgia largely abstracts water from surface water (70 %), while groundwater abstraction (30 %) is used mainly used for drinking purposes.
During 2016, about 1 980 million m3 of water was used in Georgia by different economic sectors. More than 70 % of the total water use is allocated to agriculture, while the households sector has the second highest demand for water use. Irrigation is widely used in the agriculture sector. More than 80 % of the water used by agriculture was allocated to irrigation between 1995 and 2008. Since then, the share of agricultural water use for irrigation has substantially decreased, falling to 34 % in 2016.
Although water use for hydropower is not covered by this indicator, Georgia is a country where hydropower is very dominant in electricity generation. Thus, hydropower installations put pressure on the hydromorphology of the Georgian water bodies.
In the transition period after the Soviet Union collapsed, there was a substantial decrease in the total water use in the country. The total freshwater use in 1990 was 3 623 million m3, and this had decreased to 1 979 million m3 by 2016. The sharp decrease seen between 1990 and 2004 has been reversed since then. Agriculture, which is the largest water use sector, has expanded and has increased the total water use in the country and has increased its share compared with other economic sectors.
There has been a tremendous decrease in water use by households. Between 1990 and 2016, water use by households halved, although the country’s total population decreased by only 3 % during the same time period. However, excluding the exceptional time period 1990-2000 from the assessment indicates a trend of increasing water use. The amount of water used in 2001 (1 060 million m3) had almost doubled (an 87 % increase) by 2016, mainly due to high water demand from agriculture and households.
A substantial portion of the freshwater used is lost during transport. On average, one third of the water used is lost in the water transport system. This is very high, which indicates an urgent need to renew the water transport system in the country. Given that only around 60 % of the total population is connected to the public water supply system (2016), the maintenance and rehabilitation of the water transport system in the country is becoming more important, not only for increasing water efficiency but also for improving the sanitation services.
Since 2004, no significant progress has been observed in the improvement of water losses. The combination of high water losses and an increasing demand for water by agriculture and households will eventually expose more acute water efficiency issues in the years to come.
Is water efficiently used by economic activities?
Figure 4 - Development of total freshwater use per unit of gross domestic product at purchasing power parity (1990-2015)
Data sources:
Water use data provided by Water Division of the Department of Environment and Climate Change and the Integrated Management Division of the Department of Environmental Assessment, Ministry of Environmental Protection and Agriculture
Gross Domestic Products provided by World Bank
Between 1990 and 2016, the GDP been increased by about 44 % in Georgia. Although there has been an increase in GDP, there has not been a similar increase in water use efficiency. Nevertheless, in 1990, around 145 m3 of water was used in producing 1 000 international dollars by the economy, but 38 m3 of water was used in 2015 to produce the same unit of GDP.
Indicator specification
Indicator definition
The indicator specifies the availability of freshwater from natural sources and its use to meet the needs of households, agriculture, industry and other economic activities. The water use is provided as a total for the whole country and broken down by economic activity according to the international Standard Industrial Classification of All Economic Activities (ISIC). Moreover, the indicator shows total water use per unit of GDP.
Units
The total volume of water used and the volume by economic activity are measured in million cubic metres (million m3) per year; total water use per unit of GDP is expressed as cubic metres per 1000 international dollar (constant prices, purchasing power parity).
Rationale
Justification for indicator selection
The indicator provides a measure of the freshwater use, as well as the pressure on the environment in terms of consumption of freshwater resources. The indicator is also important for defining the level of development of water economy services and the degree of water accessibility to cover the needs of the population and society.
Scientific references
UNECE, 2016. Environmental Performance Review- Georgia. United Nations Economic Commission for Europe, Committee on Environmental Policy, Environmental Performance Reviews Series No. 43, 978-92-1-057683-3, New York and Geneva.
UNECE, 2018. Guidelines for the Application of Environmental Indicators, Description of C3: Total water use.
UNECE, 2018. Guidelines for the Application of Environmental Indicators, Glossary of terms – C3: Total water use.
UNSD, 2012. International Recommendations for Water Statistics, Department of Economic and Social Affairs Statistics Division, Statistical papers, Series M No. 91, ST/ESA/STAT/SER.M/91, ISBN: 978-92-1-161545-6, New York.
Policy context and targets
Context description
National policy context
The national law on water, in effect since 1997, sets general principles on rational water use and declares that as one of its main objectives. Specifically, the law obliges all Georgian citizens to ensure the rational and sustainable use and protection of water and obliges water users to ensure the rational use of water and maintenance and restoration of its quality (Article 41). The law on water assigns satisfying population demand for safe drinking water as the highest water use priority (Article 4).
International policy context
Monitoring the efficiency of water use is important for the protection, conservation and enhancement of the European Union’s natural capital. It also contributes to improving resource efficiency, which is included as an objective of the EU's Seventh Environment Action Plan to 2020.
Targets
National targets
No specific national target has been identified.
International targets
UN SDG 6, target 6.4: by 2030, aim, by 2030, to substantially increase water use efficiency across all sectors and ensure sustainable withdrawals and supply of freshwater to address water scarcity and substantially reduce the number of people suffering from water scarcity.
Related policy documents
-
Law of Georgia on water (1997). Law of Georgia No 936‐Is of 16 October 1997
-
Sustainable Development Goals. UN (2016). Sustainable development goals, the sustainable development agenda.
Methodology
Methodology for indicator calculation
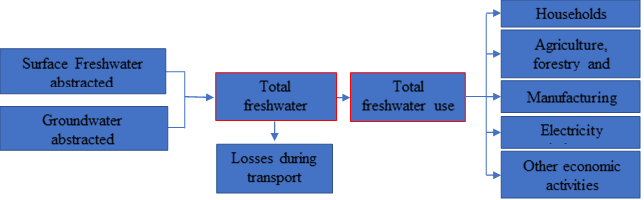
Note: Total water use = total freshwater available for use (equal to the freshwater abstracted in Georgia) - losses during transport
The unit is presented in million cubic metres (million m3). Water abstraction for hydropower is excluded from the calculation (as hydropower does not consume water). However, it does not mean that hydropower does not have an impact on the environment.
Units and equations
|
ID |
Component |
Units |
Equation |
|
C2.3 |
Freshwater abstracted |
million m3/year |
= C 2.3 (see indicator C2) |
|
C3.1 |
Desalinated water |
million m3/year |
|
|
C3.2 |
Reused water |
million m3/year |
|
|
C3.3 |
Imports of water |
million m3/year |
|
|
C3.4 |
Exports of water |
million m3/year |
|
|
C3.5 |
Total freshwater available |
million m3/year |
= C 2.3 + C 3.1 + C 3.2 + C 3.3 + C 3.4 |
|
C3.6 |
Losses of water during transport |
million m3/year |
|
|
C3.6a |
Other losses and water not for use |
million m3/year |
|
|
C3.7 |
Total freshwater use |
million m3/year |
= C 3.5 - C 3.6 - C 3.6a; = C3.8 + C3.9 + C3.11 + C3.12 + C3.13 |
|
C3.8 |
Households |
million m3/year |
|
|
C3.9 |
Agriculture, forestry and fishing (ISIC 01-03) |
million m3/year |
|
|
C3.10 |
of which used for irrigation in agriculture |
million m3/year |
|
|
C3.11 |
Manufacturing (ISIC 10-33) |
million m3/year |
|
|
C3.12 |
Electricity industry (ISIC 351) |
million m3/year |
|
|
C3.13 |
Other economic activities |
million m3/year |
|
|
C3.14 |
GDP at PPP at constant prices (2011) |
billion international dollars/year |
|
|
C 3.15 |
Total freshwater use per unit of GDP |
m3/1 000 international dollars |
= C3.7/C3.14 |
Methodology for gap filling
No gap filling has been performed.
Methodology references
-
EEA, 2005. EEA core set of indicators guide. EEA Technical report No 1/2005, ISBN 92-9167-757-4, Luxembourg.
-
UNECE, 2018. Guidelines for the Application of Environmental Indicators, Data template – C3: Total water use.
-
UNECE, 2018. Guidelines for the Application of Environmental Indicators, Description of C3: Total water use.
-
UNECE, 2018. Guidelines for the Application of Environmental Indicators, Glossary of terms – C3: Total water use.
-
UNSD and UNEP, 2013. Questionnaire 2013 on Environment Statistics. United Nations Statistics Division and United Nations Environment Programme, Questionnaire 2013 on Environment Statistics, Section Water.
Uncertainties
Methodology uncertainty
Reported data on water abstraction and water use do not have sufficient spatial and temporal coverage. No methodology is available at the moment.
Data sets uncertainty
The water quantity database does not have sufficient temporal and spatial coverage to provide a strong basis for estimating renewable water resources.
Rationale uncertainty
No uncertainty has been specified.
Data sources
-
Water use data provided by Water Division of the Department of Environment and Climate Change and the Integrated Management Division of the Department of Environmental Assessment, Ministry of Environmental Protection and Agriculture. The data is not online available yet.
-
Gross Domestic Products provided by World Bank