C2 – Freshwater abstraction in Georgia
Is water abstraction decreasing?
Figure 1 - Development of water abstraction by source (1990-2017)
Data sources:
Water abstraction data provided by Water Division of the Department of Environment and Climate Change and the Integrated Management Division of the Department of Environmental Assessment, Ministry of Environmental Protection and Agriculture
Georgia is non-water-stressed country. The annual WEI varies from around 2 % to around 5 % The WEI illustrates the level of the pressure of water abstraction on renewable water resources. Renewable water resources, overall, are under the control of climate conditions. In particular, they are affected by precipitation and actual evpotranspiration. During wet years (high precipitation and low actual evapotranspiration), the WEI would be relatively lower, while in dry years, even though water abstraction remains at the same level, the WEI would be higher.
Renewable water resources in Georgia vary greatly from year to year. In 2002, Georgia received 60 000 million m3 of renewable water resouces, which was the highest annual amount between 1995 and 2015, while 2007 was the worst year, receiving only 39 000 million m3 of renewable water resources. In 2017, the amount of renewable water resources received was 50 000 million m3, which was slightly below the annual average of 51 000 million m3. According to the estimated WEI, Georgia abstracted only 3.7 % of its total renewable water resources in 2017. Therefore, Georgia is regarded as non-water-stressed country. However, water abstraction has had a particular impact on the water quantity and discharge patterns of the rivers because 70 % of the water demand is met from this source. Groundwater is mainly used for drinking water purposes.
What are the pressures of economic activities on freshwater resources?
Figure 2 - Development of water abstraction by economic activities in Georgia (1990-2015)
Data sources:
Water abstraction data provided by Water Division of the Department of Environment and Climate Change and the Integrated Management Division of the Department of Environmental Assessment, Ministry of Environmental Protection and Agriculture
Figure 3 - Water abstraction by economic activities in Georgia (2015)
Data sources:
Water abstraction data provided by Water Division of the Department of Environment and Climate Change and the Integrated Management Division of the Department of Environmental Assessment, Ministry of Environmental Protection and Agriculture
Water abstraction has varied greatly since 1990. After the collapse of the Soviet Union, the abandonment of many agricultural and industrial areas resulted in a substantial decrease in water abstraction between 1990 and 1995. In particular, the collapse of industry after the Soviet era, as well as the transition from state-owned farms to privately owned farms, resulted in a substantial decrease in water abstraction for manufacturing industries and agriculture. By 2015, water abstraction for manufacturing industries accounted for 2 % of the total water abstraction. In 1995, the annual total water abstraction was 2 000 million m3 and this had decreased to 1 260 million m3 by 2004.
Since then there have been even more substantial decreases, and in 2015, the water abstraction per capita was around 500 m3 per year.
During the last decade, the water conveyance system has been partly improved and renewed. However, water abstraction for irrigation still poses a number of environmental problems, such as hydromorphological alterations in the water bodies due to the construction of the water conveyance system and inadequate implementation of irrigation schemes, including the dominance of gravity irrigation.
Water abstraction and the demand for water use are projected to increase in Georgia in the years to come, while agriculture is expected to remain as the main sectoral pressure on renewable water resources. Measures for improving the water conveyance systems and the application of more efficient irrigation methods are expected to increase water use efficiency and decrease the level of water demand in the near future.
Indicator specification
Indicator definition
The total volume of freshwater abstracted annually (surface and groundwater) – provided in total, by economic activity in accordance with the International Standard Industrial Classification of All Economic Activities (ISIC), and expressed as a percentage of renewable freshwater resources – i.e. as the country’s WEI.
Units
The total volume of freshwater abstraction and the volume by economic activity are measured in million cubic metres (million m3) per year; the WEI is expressed as a percentage of water abstraction over renewable water resources.
Rationale
Justification for indicator selection
Monitoring of freshwater abstraction and use is important for the protection of water resources and for their future conservation, taking into account the development of economic activities, as well as for predicting possible climate change impacts.
The WEI is a water scarcity indicator that provides information on the level of pressure that human activity exerts on the natural water resources of a territory.
Scientific references
UNECE, 2018. Guidelines for the Application of Environmental Indicators, Description of C4: Household water use per capita.
UNECE, 2018. Guidelines for the Application of Environmental Indicators, Glossary of terms – C4: Household water use per capita.
Policy context and targets
Context description
National policy context
The national law on water, in effect since 1997, sets general principles on rational water use and declares that one of its main objectives. Specifically, the law obliges all Georgian citizens to ensure the rational and sustainable use and protection of water and obliges water users to ensure the rational use of water and maintenance and restoration of its quality (Article 41). The law on water assigns satisfying population demand for safe drinking water as the highest water use priority (Article 4).
International policy context
The new draft law of Georgia on water resources management, based on the principles of the European Union Water Framework Directive and related EU water legislation, obliges a water user to ensure the rational use of water and to take measures for maintaining and restoring its quality. The draft law reintroduces permits for water abstraction and for discharges into water. Accordingly, a permit holder will be subject to pay fees for abstraction of water from surface water as well as groundwater bodies. Legal binding standards for water use efficiency will be introduced.
Targets
National targets
No specific national target has been specified
International targets
UN SDG 6, target 6.4: by 2030, substantially increase water use efficiency across all sectors and ensure sustainable withdrawals and supply of freshwater to address water scarcity and substantially reduce the number of people suffering from water scarcity.
Related policy documents
-
EU – Georgia Association Agreement (AA/DCFTA)/Association Agreement of June 27 2014 between the European Union and the European Atomic Energy Community and their Member States, of the one part, and Georgia, of the other part (OJ L 261, 30.8.2014)
-
Law of Georgia on water (1997)/Law of Georgia No 936‐Is of 16 October 1997
-
Sustainable Development Goals. UN (2016). Sustainable development goals, the sustainable
development agenda.
Methodology
Methodology for indicator calculation
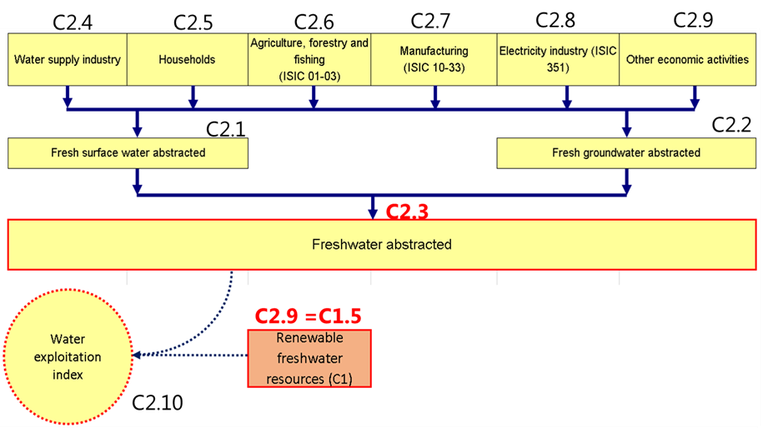
WEI = freshwater abstracted (C2.3)/renewable freshwater resources (C1.5)
|
ID |
Component |
Units |
Equation |
|
C2.1 |
Fresh surface water abstracted |
million m3 |
|
|
C2.2 |
Fresh groundwater abstracted |
million m3 |
|
|
C2.3 |
Freshwater abstracted |
million m3 |
= C 2.1 + C 2.2; = C 2.4 + C 2.5 + C 2.6 + C 2.7 + C 2.8 + C 2.9 |
|
C2.4 |
Water supply industry (ISIC 36) |
million m3 |
|
|
C2.5 |
Households |
million m3 |
|
|
C2.6 |
Agriculture, forestry and fishing (ISIC 01-03) |
million m3 |
|
|
C2.7 |
Manufacturing (ISIC 10-33) |
million m3 |
|
|
C2.8 |
Electricity industry (ISIC 351) |
million m3 |
|
|
C2.9 |
Other economic activities |
million m3 |
|
|
C2.10 |
Renewable freshwater resources (surface) |
million m3 |
|
|
C2.11 |
WEI for surface water |
percentage % |
= C 2.3/C1 |
Methodology for gap filling
No gap filling has been performed.
Methodology references
-
EEA, 2005. EEA core set of indicators guide. EEA Technical report No 1/2005, ISBN 92-9167-757-4, Luxembourg.
-
UNECE, 2018. Guidelines for the Application of Environmental Indicators, Data template – C2: Freshwater abstraction.
-
UNECE, 2018. Guidelines for the Application of Environmental Indicators, Description of C2: Freshwater abstraction.
-
UNECE, 2018. Guidelines for the Application of Environmental Indicators, Glossary of terms – C2: Freshwater abstraction.
-
UNSD and UNEP, 2013. Questionnaire 2013 on Environment Statistics. United Nations Statistics Division and United Nations Environment Programme, Questionnaire 2013 on Environment Statistics, Section Water.
Uncertainties
Methodology uncertainty
No uncertainty has been specified.
Data sets uncertainty
Reported data on water abstraction and water use do not have sufficient spatial and temporal coverage. Overall, annual reported data is available on water abstraction by source (surface water and groundwater) and water abstraction by sectors. The Ministry of Environmental Protection and Agriculture receives annual reports on water use from registered water users. The reports’ data on water abstraction, water use and wastewater discharge is summarised using a special computer program.
Rationale uncertainty
No uncertainty has been specified.
Data sources
-
Water abstraction data provided by Water Division of the Department of Environment and Climate Change and the Integrated Management Division of the Department of Environmental Assessment, Ministry of Environmental Protection and Agriculture. The data is not online available yet.