C11 - Nutrients in freshwater of the Republic of Belarus
Are concentrations of nutrient in surface waters in the Republic of Belarus decreasing?
Figure 1 - Nutrients in surface waters (1986-2017)
Data sources:
Data was provided from National Environmental Monitoring System by the Ministry of Natural Resources and Environmental Protection of the Republic of Belarus under the ENI SEIS II East project activities
C11 –Nutrients in freshwater provided by National Statistical Committee of the Republic of Belarus
Note: The data series are calculated as the average of annual mean concentrations of phosphate (mg P/l) (top) and nitrate (mg NO3-N/l) (bottom) for rivers and total phosphorus (mg P/l) for lakes in the whole of the Republic of Belarus (left) and in different river basins (right) for the period 1986-2017. The total number of rivers is 86. The total number of lakes is 74. The 2 lakes in the Western Bug river basin are not included in the aggregated time series for the whole country, because the time series starts in 2009.
An increase in nitrate and phosphate concentrations in rivers can cause eutrophication, giving an intensive growth of algae, including algae causing toxic conditions, and other aquatic vegetation, as nitrogen, and in particular phosphorus, is limiting their growth. This in turn can lead to oxygen depletion and reduced biodiversity in the bottom layers of rivers. Similarly, excess nitrogen and phosphorus can cause eutrophication in lakes.
The river phosphate concentration time series indicate that except the Western Dvina river basin, the maximum levels occurred during the period 1988-1990. There was also an increase towards 2003-2004. Over the past decade, there has been an increase in the concentrations in the Western Dvina and Neman river basins, and a decrease in the Western Bug and Dnieper river basins.
Over the time period 1986-2017 there was an increase in average annual river nitrate concentrations, both for individual river basins and the country as a whole. The concentration pattern differed between the different river basins, but except in the Western Dvina river basin there was a general increase in the period 2005-2007. In the Pripyat river basin the increase was a marked peak before returning to around the same level, while in the Neman, Dnieper and Western Bug river basins the concentration level has remained higher than before 2005. In Western Dvina the nitrate concentration has been higher since 2012.
For lake total phosphorus the average concentration was usually highest during the periods 1988-1995 and 2003-2007. The highest concentrations have been observed in the Pripyat river basin. Over the past decade, the average concentration decreased in all river basins.
What is the current state of nutrient concentrations in surface waters in the Republic of Belarus?
Figure 2 - Lakes- total phosphorus (mg P/l) (2017)
Data sources:
Data was provided from National Environmental Monitoring System by the Ministry of Natural Resources and Environmental Protection of the Republic of Belarus under the ENI SEIS II East project activities
C11 –Nutrients in freshwater provided by National Statistical Committee of the Republic of Belarus
Note: Distribution of lake monitoring sites to total phosphorus concentration classes in the different river basins (Western Dvina, Neman, Western Bug, Dnieper and Pripyat) of the Republic of Belarus, based on annual average concentrations for 2017. The number of monitoring sites per river basin is given in parenthesis.
The class system is the same as the one used in the EEA indicator WAT 003 - Nutrients in freshwater in Europe. See the indicator specification section there for further information.
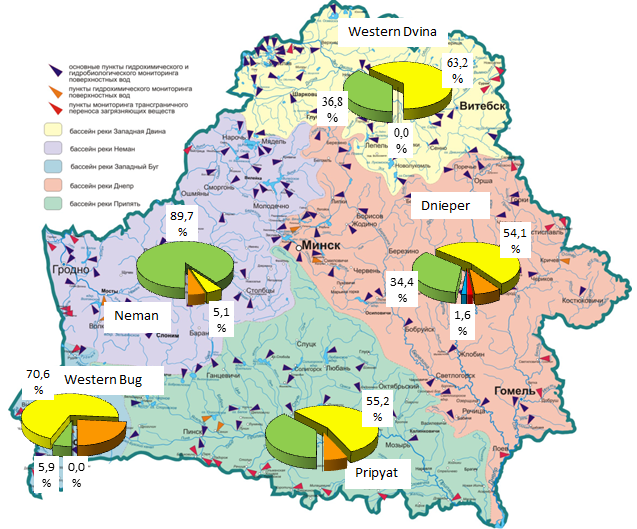
Figure 3 – Rivers – phosphate (mg P/l) (2017)
|
Ranges (mg P/l): |
|
|
|
|
|
 <0.02
<0.02  >=0.02, <0.05
 >=0.5, <0.10
 >=0.10, <0.20
 ˃= 0.20
Data sources:
Map in pdf format was provided from National Environmental Monitoring System by the Ministry of Natural Resources and Environmental Protection of the Republic of Belarus under the ENI SEIS II East project activities
Data was provided from National Environmental Monitoring System by the Ministry of Natural Resources and Environmental Protection of the Republic of Belarus under the ENI SEIS II East project activities
Note: Distribution of river monitoring sites to phosphate concentration classes in the different river basins (Western Dvina, Neman, Western Bug, Dnieper and Pripyat) of the Republic of Belarus, based on annual average concentrations for 2017.
The class system is the same as the one used in the EEA indicator WAT 003 Nutrients in freshwater in Europe. See the indicator specification section there for further information.
|
Ranges (mg P/l) |
Pripyat |
Neman |
Dnieper |
Western Bug |
Western Dvina |
|
<0.02 |
0 |
0 |
1 |
0 |
0 |
|
>=0.02, <0.05 |
11 |
35 |
21 |
1 |
7 |
|
>=0.5, <0.10 |
16 |
2 |
33 |
12 |
12 |
|
>=0.10, <0.20 |
2 |
2 |
5 |
4 |
0 |
|
˃= 0.20 |
0 |
0 |
1 |
0 |
0 |
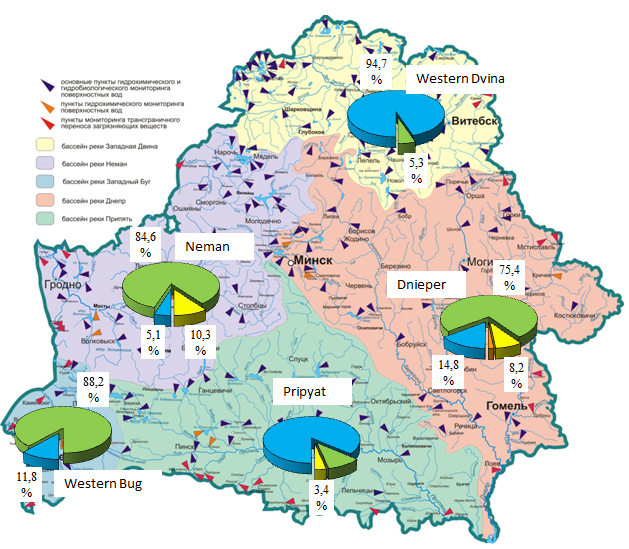
Figure 4 – Rivers – Nitrate (2017)
|
Ranges (mg NO3-N/l): |
|
|
|
|
|
Data sources:
Map in pdf format was provided from National Environmental Monitoring System by the Ministry of Natural Resources and Environmental Protection of the Republic of Belarus under the ENI SEIS II East project activities
Data was provided from National Environmental Monitoring System by the Ministry of Natural Resources and Environmental Protection of the Republic of Belarus under the ENI SEIS II East project activities
Note: Distribution of river monitoring sites to nitrate concentration classes in the different river basins (Western Dvina, Neman, Western Bug, Dnieper and Pripyat) of the Republic of Belarus, based on annual average concentrations for 2017.
The class system is the same as the one used in the EEA indicator WAT 003-Nutrients in freshwater in Europe. See the indicator specification section there for further information.
|
Ranges (mg NO3-N/l) |
Pripyat |
Neman |
Dniepr |
Western Bug |
Western Dvina |
|
<0.8 |
25 |
2 |
9 |
2 |
18 |
|
>=0.8, <2.0 |
3 |
33 |
46 |
15 |
1 |
|
>=2.0, <3.6 |
1 |
4 |
5 |
2 |
17 |
|
>=3.6, <5.6 |
0 |
6 |
1 |
12 |
2 |
|
˃=5.6 |
0 |
3 |
0 |
1 |
0 |
The present state analysis shows that the largest proportion of river sites with relatively high phosphate concentration (>0.1 mg P/l) was found in the Western Bug river basin, but only the Western Dvina had no sites in this concentration range. Sites with concentration >0.2 mg P/l were only found in the Dnieper basin. The Neman river basin had the largest proportion of river sites with lower phosphate concentration (<0.05 mg P/l). Overall, at 35% of the sites the average annual phosphate concentration exceeded the national maximum permissible concentration (0.066 mg P/l) in 2017.
For nitrate none of the river sites had average annual concentration above the national maximum permissible concentration (9.03 mg NO3-N/l) in 2017. Still there were marked differences between the different river basins, with higher concentrations in rivers in the Western Bug and in particular the Neman and Dnieper river basins. In the Pripyat river basin the majority of the sites were in the lowest concentration class, but still 3.4% were in the range 2-3.6 mg NO3-N/l.
Total phosphorus concentration above 0.1 mg P/l in lakes was only found in the Neman and Western Dvina river basins, while the majority of sites had relatively low concentration in 2017. A large proportion of sites had concentrations in the range 0.05-0.1 mg P/l in the other river basins. High concentrations can in some cases be related to direct discharge of waste water to the lakes.
Indicator specification
Indicator definition
Concentrations of phosphates and nitrates in rivers, total phosphorus in lakes.
Units
The concentration of phosphates and total phosphorus is expressed as mg of P/litre the concentration of nitrates is expressed as mg of NO3-N/litre.
Rationale
Justification for indicator selection
An increase in nitrate and phosphate concentrations in rivers can cause eutrophication, giving an intensive growth of algae, including algae causing toxic conditions, and other aquatic vegetation, as nitrogen, and in particular phosphorus, is limiting their growth. This in turn can lead to oxygen depletion and reduced biodiversity in the bottom layers of rivers. Similarly, excess nitrogen and phosphorus can cause eutrophication in lakes. Total phosphorus includes all phosphorus compounds in water: phosphate ions, dissolved organic phosphorus and phosphorus in the form of particles in algal and bacterial cells, as well as in mineral particles.
Scientific references
-
Council Directive 91/271/EEC of 21 May 1991 concerning urban wastewater treatment
-
Directive 2000/60/EC of the European Parliament and the Council of 23 October 2000 establishing a framework for Community action in the field of water policy (Water Framework Directive) http://ec.europa.eu/environment/water/waterframework/index_en.html;
Policy context and targets
Context description
National policy context
The strategic goal of preserving the country's water potential is to improve the efficiency of use and improve the quality of the water resources, balanced with the needs of society and possible climate change. This indicator is not directly related to any specific target indicator, enshrined in strategic documents. However, general regulations on the environmental quality of surface waters are contained in the following regulatory legal acts of the Republic:
-
Water strategy of the Republic of Belarus for the period up to 2020.
-
The Law of the Republic of Belarus of November 26, 1992 No. 1982-XII “On Environmental Protection”.
-
The Water Code of the Republic of Belarus of April 30, 2014 No. 149-Z.
-
Order of the Ministry of Natural Resources and Environmental Protection of the Republic of Belarus “On approval of environmental indicators of the state of the environment in the Republic of Belarus” of 12/12/2009 No. 377-ОD.
-
Resolution of the Ministry of Environment dated March 30, 2015 No. 13 “On the establishment of standards for the quality of water of surface water bodies”.
-
TCP 17.13-08-2013 Environmental protection and environmental management. Analytical control and monitoring. Rules for determining the chemical (hydrochemical) status of river ecosystems;
-
TCP 17.13-09-2013 Environmental protection and environmental management. Analytical control and monitoring. Rules for determining the chemical (hydrochemical) status of lake ecosystems;
-
TCP 17.13-10-2013 Environmental protection and environmental management. Analytical control and monitoring. Rules for determining the ecological (hydrobiological) status of river ecosystems;
-
TCP 17.13-11-2013 Environmental protection and environmental management. Analytical control Requires “on establishing the norms for assuring water quality of each Water Basin Management District, depending upon local peculiarities” and monitoring. Rules for determining the ecological (hydrobiological) status of lake ecosystems.
-
Online link to the policy documents :
International policy context
-
The Convention on the Protection and Use of Transboundary Watercourses and International Lakes (Water Convention) aims to ensure the sustainable use of transboundary water resources by facilitating cooperation. The Water Convention strengthens transboundary water cooperation and measures for the ecologically-sound management and protection of transboundary surface waters and groundwater.
Targets
National targets
The maximum permissible concentration for phosphate is 0.066 mg P/l, and for nitrate 40.0 mg NO3/l (9.03 mg NO3-N/l).
International targets
The UN Sustainable Development Goal 6 target 6.3 aims to achieve, by 2030, improve water quality by reducing pollution, eliminating dumping and minimizing release of hazardous chemicals and materials, halving the proportion of untreated wastewater and substantially increasing recycling and safe reuse globally.
Related policy documents
-
Water strategy of the Republic of Belarus for the period up to 2020.
-
The Law of the Republic of Belarus of November 26, 1992 No. 1982-XII “On Environmental Protection”.
-
The Water Code of the Republic of Belarus of April 30, 2014 No. 149-Z.
Methodology
Methodology for indicator calculation
Monitoring data from 86 rivers and 74 lakes is included. Each river/lake may have one to several monitoring sites. The monitoring frequency is normally monthly for rivers and quarterly every other year for lakes.
The sampling of surface waters is carried out in accordance with the requirements of STB 17.13.05-10-2009 / ISO 5667-6: 2005 and STB 17.13.05-32-2014 / ISO 5667-4: 1987. Chemical analyses are done according to
STB ISO 6878-2005 (phosphate), STB 17.13.05-43-2015 (nitrate) and GOST 18309-2014 Water (total phosphorus).
The average annual concentration was estimated on the basis of the results for individual samples for each monitoring site. For the time series analysis the results from individual monitoring sites were aggregated to river or lake level. Time series aggregated to the whole country or different river basins (Western Dvina, Neman, Western Bug, Dnieper and Pripyat) were then calculated as the average of the individual annual time series for each river or lake for the different determinants and water categories.
For the present state analysis, annual average values per monitoring site for 2017 were used. Each monitoring site was assigned to different classes based on the annual average.
Methodology for gap filling
No gap filling has been performed
Methodology references
-
The regulation on the procedure for conducting monitoring of surface waters and using its data in the National Environmental Monitoring System in the Republic of Belarus // Resolution of the Council of Ministers of the Republic of Belarus of April 28, 2004 No. 482.
-
STB 17.13.05-10-2009 / ISO 5667-6: 2005 Environmental protection and environmental management. Analytical control and monitoring. Water quality. Sample selection. Part 6. Guide to sampling from rivers and other watercourses.
-
STB 17.13.05-32-2014 / ISO 5667-4: 1987 Environmental protection and environmental management. Analytical control and monitoring. Water quality. Sample selection. Part 4. Guide to sampling from lakes and other bodies of water.
-
STB ISO 6878-2005 Environmental protection and environmental management. Analytical control and monitoring. Water quality. Determination of phosphorus. Ammonium molybdate spectrometric method.
-
STB 17.13.05-43-2015 Environmental protection and environmental management. Analytical (laboratory) control and environmental monitoring. Water quality. Determination of nitrate nitrogen concentration by photometric method with salicylic acid.
-
GOST 18309-2014 Water. Methods for the determination of phosphorus-containing substances.
-
EEA, 2005. EEA core set of indicators guide. EEA Technical report No 1/2005, ISBN 92-9167-757-4,
Luxembourg.
-
UNECE, 2018. Guidelines for the Application of Environmental Indicators, Description of C11. Nutrients in freshwater.
-
UNECE, 2018. Guidelines for the Application of Environmental Indicators, Glossary of terms – C11. Nutrients in freshwater.
-
UNSD and UNEP, 2013. Questionnaire 2013 on Environment Statistics. United Nations Statistics Division and United Nations Environment Programme, Questionnaire 2013 on Environment Statistics, Section Water.
Uncertainties
Methodology uncertainty
No methodological uncertainty has been specified.
Data sets uncertainty
No uncertainty has been specified.
Rationale uncertainty
Due to the frequency of the lake monitoring, the results may not always reflect the severity of the problems.
Data sources
Data was provided from National Environmental Monitoring System by the Ministry of Natural Resources and Environmental Protection of the Republic of Belarus under the ENI SEIS II East project activities
C11 –Nutrients in freshwater provided by National Statistical Committee of the Republic of Belarus