C11- Nutrients in freshwater of the Republic of Armenia
Are concentrations of nutrients in surface water of the Republic of Armenia decreasing?
Figure 1 - Nutrients in surface waters (2008-2017)
Data sources:
Data was provided by the Ministry of Environment of the Republic of Armenia under the ENI SEIS II East project activities
(C10, C11) Water quality indicator, by observation points and years provided by ArmStatBank
Note: The data series are calculated as the average of annual mean concentrations for river and lake monitoring sites in Armenia for the period 2008-2017. The number of river sites is 45 (21 sites above settlements and 24 below), representing 22 rivers. The number of lake sites (Lake Sevan) is 4. The right hand river plots show the average time series without the site 55.
Large inputs of nutrients to freshwater from urban and agricultural point and non-point sources can lead to ecological changes, eutrophication of water and have negative impacts on the use of water for human consumption and other purposes. The main source of nutrients in Armenia is agriculture, wastewater and storm water. There are only six treatment plants in Armenia, with mechanical treatment only. Nitrate pollution is mainly associated with agriculture.
The average river nitrate concentration below settlements increased by 29% from 2008 to 2017. This is related to increased emissions from wastewater and agriculture. Above settlements there was a slight decrease (5%), leading to a less marked increase for the set of river sites as a whole (18%). Over the same period the average river phosphate concentration below settlements increased by 244%. However, the concentrations in 2008 were particularly low. Looking at the time period 2009-2017 the increase was 34% below settlements. Although the average concentration level was lower, the relative increase was about the same above settlements (31%). Overall, this gave an increase of 33% from 2009 to 2017 (265% compared to 2008).
River Hrazdan is one of the longest and most polluted rivers in Armenia, and especially the site 55, which is the nearest site after Yerevan City has very high phosphate concentrations. Removing this site from the average reduces the phosphate concentration below settlements by 14-27%, depending on the year, and consequently the average concentration across all sites is also reduced. No such effect is seen for nitrate, indicating that wastewater is the major contributor at this site.
Average nutrient concentrations in Lake Sevan increased markedly over the period 2008-2012, which was a result of the increasing lake level. Residential buildings, roads and forests were covered with water, which led to hydromorphological changes and caused nutrient pollution of Lake Sevan.
Average total phosphorus concentration in Lake Sevan increased over the period 2013-2017. Diffuse runoff from agricultural land and untreated domestic wastewater continues to be important sources of phosphorus emissions to Lake Sevan. These pollution sources do not have a big impact on the rivers in the region, but they affect Lake Sevan due to direct discharge into the lake. Moreover, phosphorus stored in the sediment can keep lake concentrations high and prevent improvement of the water quality.
What is the current state of nutrient pollution of surface waters in the Republic of Armenia?
Figure 2 - Rivers – phosphate and nitrate (2017), using the national classification system
Data sources:
Data was provided by the Ministry of Environment of the Republic of Armenia under the ENI SEIS II East project activities
(C10, C11) Water quality indicator, by observation points and years provided by ArmStatBank
Note: Distribution of river monitoring sites to phosphate (left) and nitrate (right) water quality classes in the different river basins (Akhuryan, Ararat, Hrazdan, Northern, Sevan, Southern) of the Republic of Armenia, based on annual average concentrations for 2017. The number of monitoring sites per river basin is given in parenthesis. The national class system is used. See the “National target” section of the indicator specification for detailed information on the applied national classes.
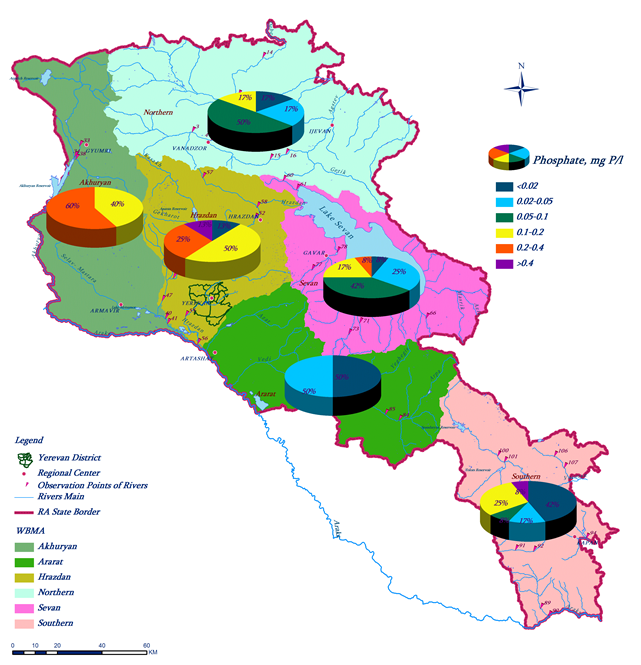
Figure 3 - Rivers – Phosphate (2017)
Data sources:
The map in pdf format was provided by the Ministry of Environment of the Republic of Armenia under the ENI SEIS II East project activities
Note: Distribution of river monitoring sites to phosphate concentration classes in the different river basins (Akhuryan, Ararat, Hrazdan, Northern, Sevan, Southern) of the Republic of Armenia, based on annual average concentrations for 2017. The class system is the same as the one used in the EEA indicator WAT 003 Nutrients in freshwater in Europe. See the indicator specification section there for further information.
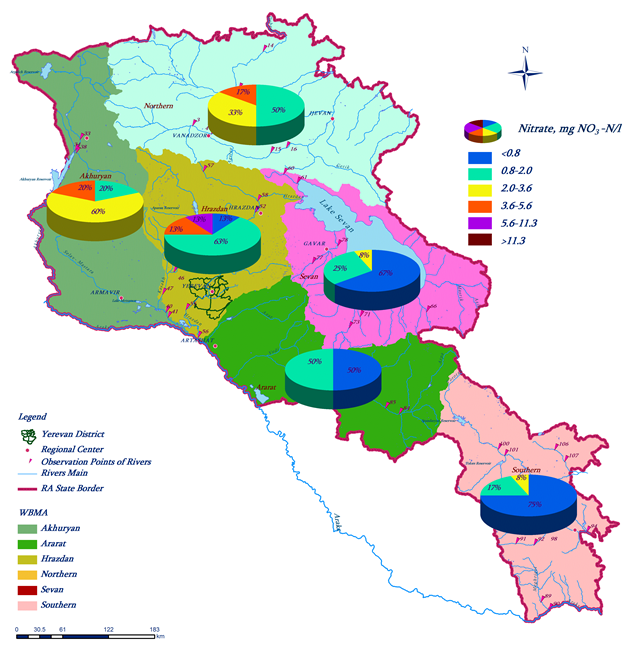
Figure 4- Rivers – Nitrate (2017)
Data sources:
The map in pdf format was provided by the Ministry of Environment of the Republic of Armenia under the ENI SEIS II East project activities.
Note: Distribution of river monitoring sites to nitrate concentration classes in the different river basins (Akhuryan, Ararat, Hrazdan, Northern, Sevan, Southern) of the Republic of Armenia, based on annual average concentrations for 2017. The class system is the same as the one used in the EEA indicator CSI 020 Nutrients in freshwater in Europe. See the indicator specification section there for further information.
Nutrient concentrations are generally higher below than above settlements, due to emissions of wastewater and other human activities. On average, average phosphate concentration for monitoring sites below settlements were 3.3 times higher than the average concentration for sites above settlements in 2017. The corresponding number for nitrate concentration was 2.4.
The Hrazdan and Southern river basins are the only ones with sites in bad quality for phosphate (13% and 8%, respectively) in 2017. The Akhuryan (100%) and Hrazdan (88%) river basins had the highest proportion of sites with less than good quality.
For nitrate there were no rivers in bad quality in 2017, but 13% of the river sites in the Hrazdan river basin had poor quality. The highest share of sites with less than good quality was found in the Akhuryan (40%), Northern (33%) and Hrazdan (25%) river basins. The Southern river basin had no river sites in less than good quality and a high proportion of sites in high quality (83)*.
Overall the highest phosphate concentration in 2017 was observed at the river site below Yerevan City in Hrazdan river basin (monitoring site 55). The Hrazdan river basin is the most populated river basin in Armenia and had a high proportion of sites with high nutrient concentrations, especially phosphate. The other river basin with a high proportion of sites with elevated nutrients concentration was Akhuryan, where the second populated city (Gyumri) is located. The wastewaters of both cities discharge directly into the rivers due to lack of wastewater treatment plants.
The four lake sites all had concentrations corresponding to the high quality class with respect to nitrate. The total phosphorus concentrations were also relatively low (0.08-0.09 mg P/l) in 2017, but if the increasing trend continues it may reach levels that can cause eutrophication.
Indicator specification
Indicator definition
Concentrations of phosphate and nitrate in rivers and total phosphorus and nitrates in lakes
Units
The concentration of phosphate and total phosphorus is expressed as mg of P/litre the concentration of nitrate is expressed as mg of NO3-N/litre.
Rationale
Justification for indicator selection
Large inputs of nitrogen and phosphorus to water bodies from urban areas, industry and agricultural areas can cause ecological changes that can result in a loss of plant and animal species (reduction in ecological status) and have negative impacts on the use of water for human consumption and other purposes.
Scientific references
-
Council Directive 91/271/EEC of 21 May 1991 concerning urban wastewater treatment
-
Directive 2000/60/EC of the European Parliament and the Council of 23 October 2000 establishing a framework for Community action in the field of water policy (Water Framework Directive) http://ec.europa.eu/environment/water/waterframework/index_en.html;
-
UNECE, 2018. Guidelines for the Application of Environmental Indicators, Description of C11. Nutrients in freshwater.
-
UNECE, 2018. Guidelines for the Application of Environmental Indicators, Glossary of terms – Description of C11. Nutrients in freshwater.
Policy context and targets
Context description
National policy context
This Code regulates water relations in the field of use, protection and development of water resources for guaranteed, adequate and safe supply of water for the population, protection of the environment and promotion of the rational development of the water fund of the country.
Requires “on establishing the norms for assuring water quality of each Water Basin Management District, depending upon local peculiarities”
International policy context
The UNECE-WHO/Europe Protocol on Water and Health aims to protect human health by better water management and by reducing water-related diseases. The Protocol provides a framework to translate into practice the human rights to water and sanitation and to implement SDG 6. Armenia signed the Water and Health Protocol in 1999, however, ratification is under the process and not finalized yet.
Targets
National targets
The norms for some parameters according to Government Decision №75-N:
|
Parameter |
Water Classes |
||||
|
I (high) |
II (good) |
III (moderate) |
IV (poor) |
V (bad) |
|
|
Nitrate (mg NO3-N/l) |
<1 |
1-2.5 |
2.5-5.6 |
5.6-11.3 |
>11.3 |
|
Phosphate (mg P/l) |
<0.05 |
0.05-0.1 |
0.1-0.2 |
0.2-0.4 |
>0.4 |
International targets
The UN Sustainable Development Goal 6 target 6.3 aims to achieve, by 2030, improve water quality by reducing pollution, eliminating dumping and minimizing release of hazardous chemicals and materials, halving the proportion of untreated wastewater and substantially increasing recycling and safe reuse globally.
Related policy documents
Methodology
Methodology for indicator calculation
The monitoring programme for nitrate and phosphate concentrations in rivers is structured to take into account the spatial and temporal dynamics of the indicators. The monitoring sites are located both before and after settlements, which provides information both on background concentrations and the influence of the settlements. The number of rivers sites is 45 (21 sites above settlements and 23 below), representing 21 rivers. The monitoring frequency is 7-12 per year, covering all hydrological phases.
The chemical analyses are carried out at the Laboratory of the Environmental Monitoring and Information Center of the Ministry of Nature Protection of the Republic of Armenia.
Annual time series for each site are calculated by averaging the values for individual samples per year. Aggregated time series are calculated as the average of the individual annual time series. For rivers separate aggregations are made for river sites above and below settlements.
Methodology for gap filling
For time series and trend analyses, only series that are complete (i.e. no missing values in the site data series) are used. This is to ensure that the aggregated data series are consistent, i.e. including the same sites throughout the time series. In this way assessments are based on actual changes in concentration, and not changes in the number of sites. No gap filling has been applied for the river sites, but for some of the lake sites missing data in 2013-14 were gap filled by linear interpolation.
Methodology references
-
ISO 6878:2004- Water quality — Determination of phosphorus — Ammonium molybdate spectrometric method. ISO 6878:2004 specifies methods for the determination of orthophosphate, orthophosphate after solvent extraction, hydrolysable phosphate plus orthophosphate, and total phosphorus after decomposition.
-
ISO 7890-3:1988 -Water quality — Determination of nitrate — Part 3: Spectrometric method using sulfosalicylic acid. Procedure given is applicable to raw and potable water
-
EEA, 2005. EEA core set of indicators guide. EEA Technical report No 1/2005, ISBN 92-9167-757-4, Luxembourg.
-
UNECE, 2018. Guidelines for the Application of Environmental Indicators, Description of C11. Nutrients in freshwater.
-
UNECE, 2018. Guidelines for the Application of Environmental Indicators, Glossary of terms – C11. Nutrients in freshwater.
-
UNSD and UNEP, 2013. Questionnaire 2013 on Environment Statistics. United Nations Statistics Division and United Nations Environment Programme, Questionnaire 2013 on Environment Statistics, Section Water.
Uncertainties
Methodology uncertainty
No methodological uncertainty has been specified.
Data sets uncertainty
No uncertainty has been specified.
Rationale uncertainty
No uncertainty has been specified.
Data sources
-
ArmStat - Annual mean Annual mean concentration values of nitrate and phosphate for most monitoring sites are published at ARMSTAT
-
Environmental Monitoring and Information Center SNCO - Data on nutrient concentrations in surface waters are available for several decades (since 1977) and are stored in the national database: Water Base - Environmental Monitoring and Information Center SNCO, Ministry of Environment of the Republic of Armenia.
-
Water Quality report 2018. The classification of the river monitoring sites based on nitrate and phosphate concentrations (according to national water quality norms) are published in monthly and annual surface water quality reports by the Environmental Monitoring and Information Center SNCO, Ministry of Environment of the Republic of Armenia,