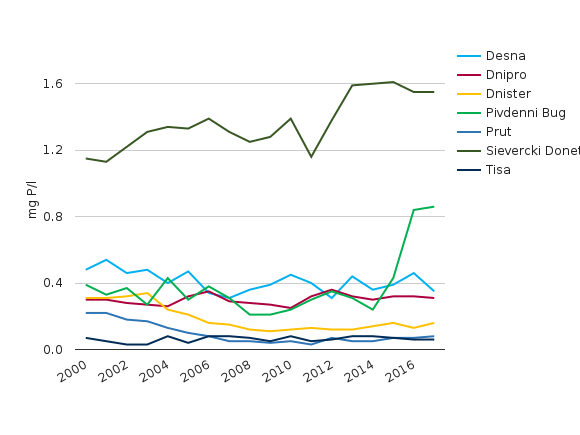
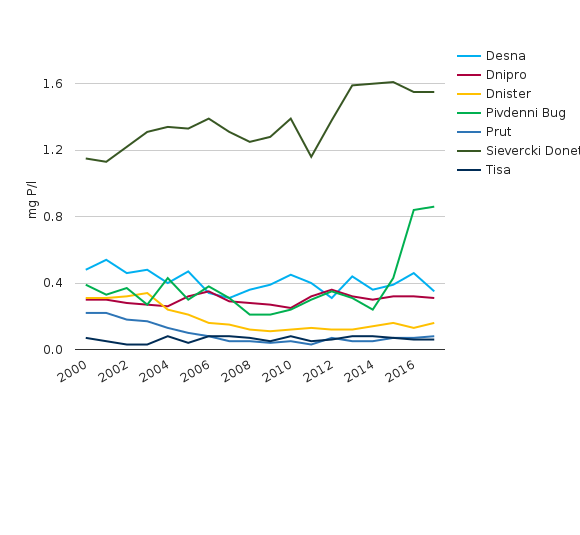
Figure 4
Figure 4 – Changes in phosphate (P) concentrations in rivers in Ukraine (2000-2017)
RichTextValue object. (Did you mean .raw or .output?)
This project is funded by the European Union