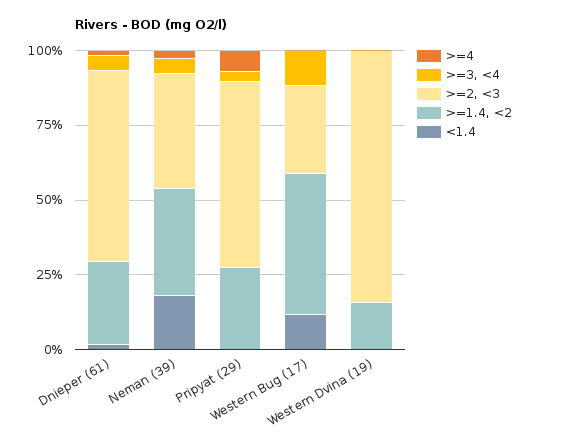
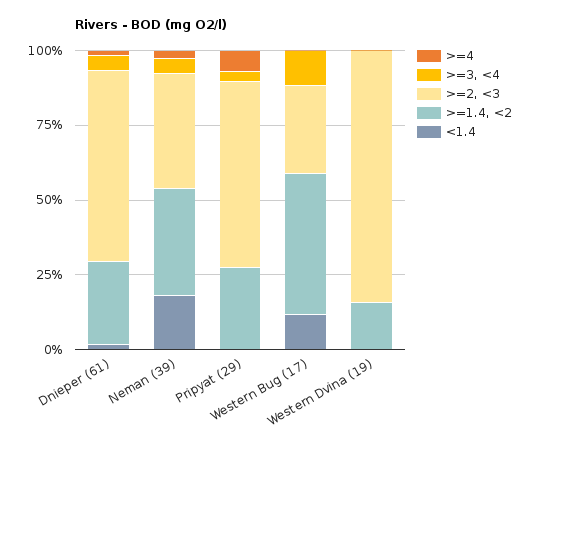
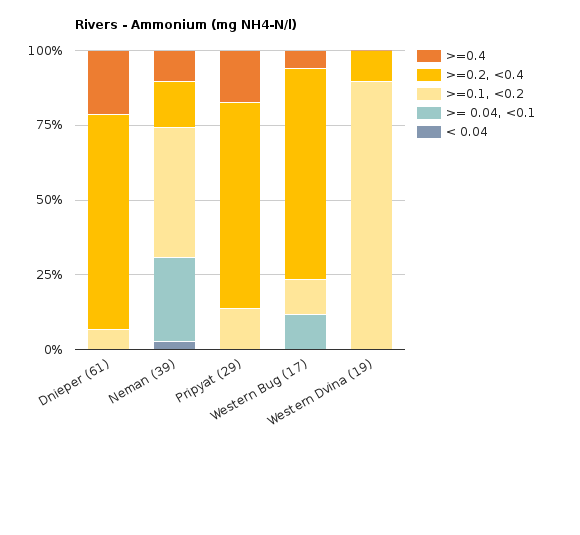
Figure 2
Figure 2 - Rivers - BOD and Ammonium (2017)
RichTextValue object. (Did you mean .raw or .output?)
This project is funded by the European Union