Data Visualization
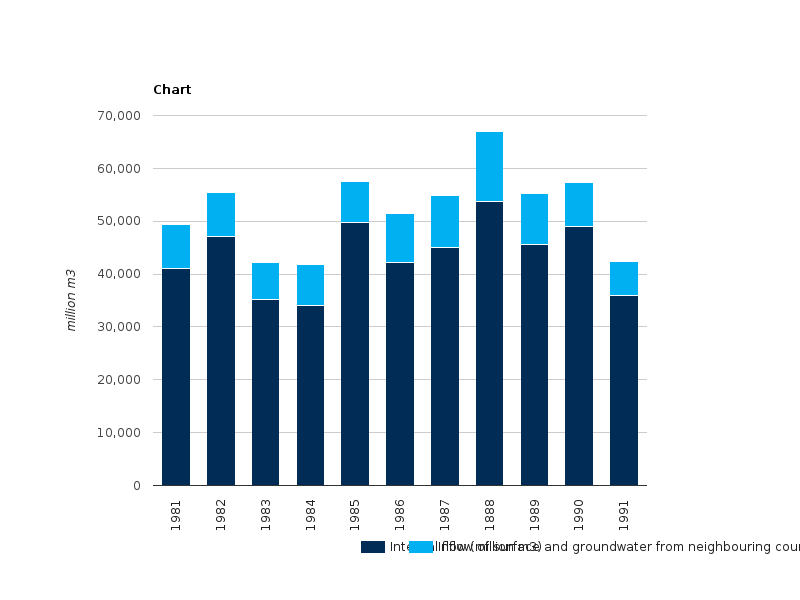
Figure 1- Development of renewable freshwater resources in Georgia (1981-1991)
RichTextValue object. (Did you mean .raw or .output?)
This project is funded by the European Union